Stellar Spectra
Stellar spectra can be generated by combining a Stars object with an EmissionModel, translating the properties of the stellar populations (typically initial_masses, ages and metallicities) to a spectral energy distribution.
These models are described in detail in the emission model docs. Here, we’ll use an instance of a PacmanEmission model for demonstration purposes.
The following sections demonstrate the generation of integrated spectra (which is the same for both parametric and particle Stars), and per–particle spectra.
[1]:
from unyt import K, Msun, Myr

from synthesizer.emission_models import PacmanEmission
from synthesizer.emission_models.attenuation import PowerLaw
from synthesizer.emission_models.dust.emission import Greybody
from synthesizer.grid import Grid
from synthesizer.load_data.load_camels import load_CAMELS_IllustrisTNG
from synthesizer.parametric import SFH, Stars, ZDist

tau_v = 0.5
# dust curve slope
alpha = -1.0
dust_curve = PowerLaw(slope=alpha)
dust_emission_model = Greybody(30 * K, 1.2)

grid_dir = "../../../tests/test_grid"
grid_name = "test_grid"
grid = Grid(grid_name, grid_dir=grid_dir)

stellar_mass = 10**11 * Msun
sfh = SFH.Constant(max_age=100 * Myr)
metal_dist = ZDist.Normal(mean=0.01, sigma=0.05)

# Get the 2D star formation and metal enrichment history for the
# given SPS grid. This is (age, Z).
stars = Stars(
    grid.log10age,
    grid.metallicity,
    sf_hist=sfh,
    metal_dist=metal_dist,
    initial_mass=stellar_mass,
)

# Get the model
pacman = PacmanEmission(
    grid=grid,
    tau_v=tau_v,
    dust_curve=dust_curve,
    dust_emission=dust_emission_model,
)
Integrated spectra
To generate integrated spectra we simply call the components get_spectra method. This method will populate the component’s spectra attribute with a dictionary containing Sed objects for each spectra in the EmissionModel and will also return the spectra at the root of the EmissionModel.
[2]:
# Get the spectra using a unified agn model (instantiated elsewhere)
spectra = stars.get_spectra(pacman)
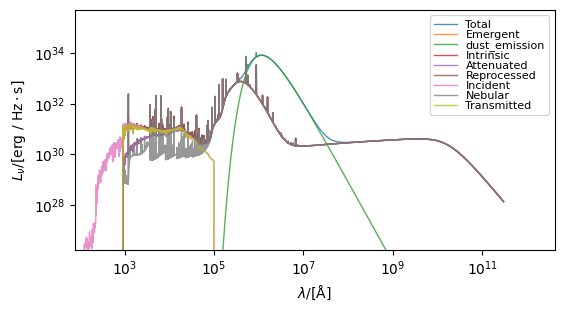
We can plot the resulting spectra using the plot_spectra method.
[3]:
fig, ax = stars.plot_spectra(show=True, figsize=(6, 4))

The spectra returned by get_spectra is the “total” spectra at the root of the emission model.
[4]:
print(spectra)
+-------------------------------------------------------------------------------------------------+
|                                               SED                                               |
+---------------------------+---------------------------------------------------------------------+
| Attribute                 | Value                                                               |
+---------------------------+---------------------------------------------------------------------+
| redshift                  | 0                                                                   |
+---------------------------+---------------------------------------------------------------------+
| ndim                      | 1                                                                   |
+---------------------------+---------------------------------------------------------------------+
| shape                     | (9244,)                                                             |
+---------------------------+---------------------------------------------------------------------+
| lam (9244,)               | 1.30e-04 Å -> 2.99e+11 Å (Mean: 9.73e+09 Å)                         |
+---------------------------+---------------------------------------------------------------------+
| nu (9244,)                | 1.00e+07 Hz -> 2.31e+22 Hz (Mean: 8.51e+19 Hz)                      |
+---------------------------+---------------------------------------------------------------------+
| lnu (9244,)               | 0.00e+00 erg/(Hz*s) -> 1.07e+34 erg/(Hz*s) (Mean: 3.96e+32 erg)     |
+---------------------------+---------------------------------------------------------------------+
| bolometric_luminosity     | 4.772754179003649e+46 erg/s                                         |
+---------------------------+---------------------------------------------------------------------+
| bolometric_luminosity     | 4.772754179003649e+46 erg/s                                         |
+---------------------------+---------------------------------------------------------------------+
| energy (9244,)            | 4.14e-08 eV -> 9.56e+07 eV (Mean: 3.52e+05 eV)                      |
+---------------------------+---------------------------------------------------------------------+
| frequency (9244,)         | 1.00e+07 Hz -> 2.31e+22 Hz (Mean: 8.51e+19 Hz)                      |
+---------------------------+---------------------------------------------------------------------+
| llam (9244,)              | 0.00e+00 erg/(s*Å) -> 5.27e+43 erg/(s*Å) (Mean: 1.32e+41 erg/(s*Å)) |
+---------------------------+---------------------------------------------------------------------+
| luminosity (9244,)        | 0.00e+00 erg/s -> 7.48e+46 erg/s (Mean: 1.55e+45 erg/s)             |
+---------------------------+---------------------------------------------------------------------+
| luminosity_lambda (9244,) | 0.00e+00 erg/(s*Å) -> 5.27e+43 erg/(s*Å) (Mean: 1.32e+41 erg/(s*Å)) |
+---------------------------+---------------------------------------------------------------------+
| luminosity_nu (9244,)     | 0.00e+00 erg/(Hz*s) -> 1.07e+34 erg/(Hz*s) (Mean: 3.96e+32 erg)     |
+---------------------------+---------------------------------------------------------------------+
| wavelength (9244,)        | 1.30e-04 Å -> 2.99e+11 Å (Mean: 9.73e+09 Å)                         |
+---------------------------+---------------------------------------------------------------------+
However, all the spectra are stored within a dictionary under the spectra attribute on the relevant component.
[5]:
print(stars.spectra)
{'transmitted': <synthesizer.sed.Sed object at 0x7f7c4c9cb1c0>, 'nebular': <synthesizer.sed.Sed object at 0x7f7c4c9cb2b0>, 'incident': <synthesizer.sed.Sed object at 0x7f7c4c9cb340>, 'reprocessed': <synthesizer.sed.Sed object at 0x7f7c4c9f5570>, 'emergent': <synthesizer.sed.Sed object at 0x7f7c4c9f7ac0>, 'intrinsic': <synthesizer.sed.Sed object at 0x7f7c4c9f4850>, 'attenuated': <synthesizer.sed.Sed object at 0x7f7c4c9f7970>, 'dust_emission': <synthesizer.sed.Sed object at 0x7f7c4c9f71f0>, 'total': <synthesizer.sed.Sed object at 0x7f7c4c9f6980>}
Particle spectra
In this example we load some test particle data from CAMELS:
[6]:
# Create stars component object
stars = load_CAMELS_IllustrisTNG(
    "../../../tests/data/",
    snap_name="camels_snap.hdf5",
    group_name="camels_subhalo.hdf5",
    physical=True,
)[1].stars
To generate a spectra for each star particle we use the same model, but we need to tell the model to produce a spectrum for each particle. This is done by setting the per_particle flag to True on the model.
[7]:
pacman.set_per_particle(True)
With that done we just call the same get_spectra method on the component, and the particle spectra will be stored in the particle_spectra attribute of the component.
[8]:
spectra = stars.get_spectra(pacman, verbose=True)
Again, the returned spectra is the “total” spectra from the root of the model.
[9]:
print(spectra)
+-----------------------------------------------------------------------------------------------------+
|                                                 SED                                                 |
+-------------------------------+---------------------------------------------------------------------+
| Attribute                     | Value                                                               |
+-------------------------------+---------------------------------------------------------------------+
| redshift                      | 0                                                                   |
+-------------------------------+---------------------------------------------------------------------+
| ndim                          | 2                                                                   |
+-------------------------------+---------------------------------------------------------------------+
| shape                         | (656, 9244)                                                         |
+-------------------------------+---------------------------------------------------------------------+
| lam (9244,)                   | 1.30e-04 Å -> 2.99e+11 Å (Mean: 9.73e+09 Å)                         |
+-------------------------------+---------------------------------------------------------------------+
| nu (9244,)                    | 1.00e+07 Hz -> 2.31e+22 Hz (Mean: 8.51e+19 Hz)                      |
+-------------------------------+---------------------------------------------------------------------+
| lnu (656, 9244)               | 0.00e+00 erg/(Hz*s) -> 6.63e+27 erg/(Hz*s) (Mean: 1.27e+26 erg)     |
+-------------------------------+---------------------------------------------------------------------+
| bolometric_luminosity (656,)  | 1.21e+40 erg/s -> 8.52e+40 erg/s (Mean: 3.71e+40 erg/s)             |
+-------------------------------+---------------------------------------------------------------------+
| bolometric_luminosity (656,)  | 1.21e+40 erg/s -> 8.52e+40 erg/s (Mean: 3.71e+40 erg/s)             |
+-------------------------------+---------------------------------------------------------------------+
| energy (9244,)                | 4.14e-08 eV -> 9.56e+07 eV (Mean: 3.52e+05 eV)                      |
+-------------------------------+---------------------------------------------------------------------+
| frequency (9244,)             | 1.00e+07 Hz -> 2.31e+22 Hz (Mean: 8.51e+19 Hz)                      |
+-------------------------------+---------------------------------------------------------------------+
| llam (656, 9244)              | 0.00e+00 erg/(s*Å) -> 5.21e+36 erg/(s*Å) (Mean: 9.27e+34 erg/(s*Å)) |
+-------------------------------+---------------------------------------------------------------------+
| luminosity (656, 9244)        | 0.00e+00 erg/s -> 4.41e+40 erg/s (Mean: 1.21e+39 erg/s)             |
+-------------------------------+---------------------------------------------------------------------+
| luminosity_lambda (656, 9244) | 0.00e+00 erg/(s*Å) -> 5.21e+36 erg/(s*Å) (Mean: 9.27e+34 erg/(s*Å)) |
+-------------------------------+---------------------------------------------------------------------+
| luminosity_nu (656, 9244)     | 0.00e+00 erg/(Hz*s) -> 6.63e+27 erg/(Hz*s) (Mean: 1.27e+26 erg)     |
+-------------------------------+---------------------------------------------------------------------+
| wavelength (9244,)            | 1.30e-04 Å -> 2.99e+11 Å (Mean: 9.73e+09 Å)                         |
+-------------------------------+---------------------------------------------------------------------+
While the spectra produced by get_particle_spectra are stored in a dictionary under the particle_spectra attribute.
[10]:
print(stars.particle_spectra)
{'transmitted': <synthesizer.sed.Sed object at 0x7f7c4c9f7bb0>, 'nebular': <synthesizer.sed.Sed object at 0x7f7bf8519930>, 'incident': <synthesizer.sed.Sed object at 0x7f7bf854d030>, 'reprocessed': <synthesizer.sed.Sed object at 0x7f7bf85cf730>, 'emergent': <synthesizer.sed.Sed object at 0x7f7bf85cf8e0>, 'intrinsic': <synthesizer.sed.Sed object at 0x7f7bf85cfd30>, 'attenuated': <synthesizer.sed.Sed object at 0x7f7bf85cf430>, 'dust_emission': <synthesizer.sed.Sed object at 0x7f7bf85cfac0>, 'total': <synthesizer.sed.Sed object at 0x7f7bf85cfb20>}
Integrating spectra
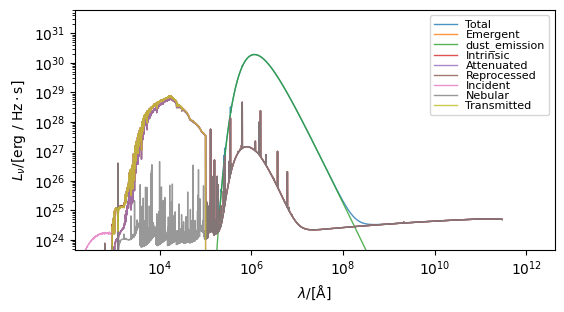
The integrated spectra are automatically produced alongside per particle spectra. However, if we wanted to explictly get the integrated spectra from the particle spectra we just generated (for instance if we had made some modification after generation), we can call the integrate_particle_spectra method. This method will sum the individual spectra, and populate the spectra dictionary.
Note that we can also integrate individual spectra using the `Sed.sum() method <../sed/sed.ipynb>`__.
[11]:
print(stars.spectra)
stars.integrate_particle_spectra()
print(stars.spectra)

fig, ax = stars.plot_spectra(show=True, figsize=(6, 4))
{'transmitted': <synthesizer.sed.Sed object at 0x7f7c4c9c8a90>, 'nebular': <synthesizer.sed.Sed object at 0x7f7bf854d390>, 'incident': <synthesizer.sed.Sed object at 0x7f7bf854cdc0>, 'reprocessed': <synthesizer.sed.Sed object at 0x7f7bf85cfc70>, 'emergent': <synthesizer.sed.Sed object at 0x7f7bf85cfee0>, 'intrinsic': <synthesizer.sed.Sed object at 0x7f7bf85cfdf0>, 'attenuated': <synthesizer.sed.Sed object at 0x7f7bf85cfe20>, 'dust_emission': <synthesizer.sed.Sed object at 0x7f7bf85cfd90>, 'total': <synthesizer.sed.Sed object at 0x7f7bf85cfb50>}
{'transmitted': <synthesizer.sed.Sed object at 0x7f7bf85cfc40>, 'nebular': <synthesizer.sed.Sed object at 0x7f7bf8519de0>, 'incident': <synthesizer.sed.Sed object at 0x7f7bf8519540>, 'reprocessed': <synthesizer.sed.Sed object at 0x7f7c4c9cb520>, 'emergent': <synthesizer.sed.Sed object at 0x7f7bf851a920>, 'intrinsic': <synthesizer.sed.Sed object at 0x7f7bf85cfc70>, 'attenuated': <synthesizer.sed.Sed object at 0x7f7c4c9c8a90>, 'dust_emission': <synthesizer.sed.Sed object at 0x7f7bf85cfdf0>, 'total': <synthesizer.sed.Sed object at 0x7f7bf85cfe20>}

Modifying EmissionModel parameters with get_spectra
As well as modifying a model explicitly, it’s also possible to overide the properties of a model at the point get_spectra is called. These modifications will not be remembered by the model afterwards. As it stands, this form of modifications is supported for the dust_curve, tau_v, fesc and masks.
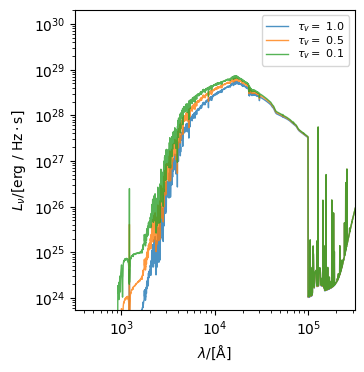
Here we’ll demonstrate this by overiding the optical depths to generate spectra for a range of tau_v values. This can either be done by passing a single number which will overide all optical depths on every model.
[12]:
# Since we now want integrated spectra lets remove the per particle flag
pacman.set_per_particle(False)

stars.clear_all_spectra()
spectra = {}
for tau_v in [0.1, 0.5, 1.0]:
    stars.get_spectra(pacman, tau_v=tau_v)
    spectra[r"$\tau_v " f"= {tau_v}"] = stars.spectra["attenuated"]
Or we can pass a dictionary mapping model labels to tau_v values to target specific models. Notice that we have invoked the clear_all_spectra method to reset the spectra dictionary, we can also clear all emissions (including spectra, lines, and photometry if they are present) with the clear_all_emissions method.
[13]:
stars.clear_all_emissions()
spectra = {}
for tau_v in [0.1, 0.5, 1.0]:
    stars.get_spectra(pacman, tau_v={"attenuated": tau_v})
    spectra[r"$\tau_v " f"=$ {tau_v}"] = stars.spectra["attenuated"]
To see the variation above we can pass the dictionary we populated with the varied spectra to the plot_spectra function (where the dictionary keys will be used as labels).
[14]:
from synthesizer.sed import plot_spectra

plot_spectra(spectra, xlimits=(10**2.5, 10**5.5))
[14]:
(<Figure size 350x500 with 1 Axes>,
 <Axes: xlabel='$\\lambda/[\\mathrm{\\AA}]$', ylabel='$L_{\\nu}/[\\mathrm{\\rm{erg} \\ / \\ \\rm{Hz \\cdot \\rm{s}}}]$'>)
