Note
Go to the end to download the full example code.
Generate parametric morphology profile
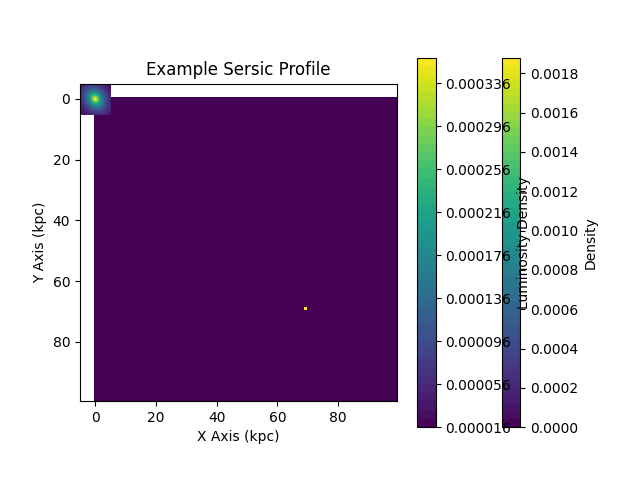
Examples for generating morphology profiles for parametric galaxies. This example demonstrates: - Defining a resolution and grid for storing binned luminosity values. - Calculating a density grid for a 2 dimensional Gaussian profile. - Calculating a density grid for a point source. - Calculating a density grid for a 2 dimensional Sersic profile.
Each resulting density distribution is visualised using matplotlib.

# Import necessary modules
import matplotlib.pyplot as plt
import numpy as np
from astropy.cosmology import FlatLambdaCDM
from unyt import kpc, unyt_array

from synthesizer.parametric.morphology import (
    Gaussian2D,
    PointSource,
    Sersic2D,
)

# Define resolution and npix for density grid
resolution = 0.1 * kpc
npix = (100, 100)


# Define arrays for 2D grid
x_dat = unyt_array(np.linspace(-5, 5, 100), "kpc")
y_dat = unyt_array(np.linspace(-5, 5, 100), "kpc")

xx, yy = np.meshgrid(x_dat, y_dat)


# Define cosmology and redshift
cosmo = FlatLambdaCDM(H0=70, Om0=0.3)
redshift = 0.5


# 2D Gaussian example usage

# Define gaussian values with units
gaussian = Gaussian2D(
    x_mean=0 * kpc,
    y_mean=0 * kpc,
    stddev_x=1 * kpc,
    stddev_y=1 * kpc,
    rho=0.5,
)


# Define Gaussian plot density grid
gaussian_density_grid = gaussian.get_density_grid(resolution, npix)


# Plot figure from
plt.contourf(xx, yy, gaussian_density_grid, levels=50)
plt.colorbar(label="Density")
plt.xlabel("X Axis (kpc)")
plt.ylabel("Y Axis (kpc)")
plt.title(("Example 2D Gaussian Distribution"))
plt.show()


# PointSource example usage

# Define offset and create density grid
offset = unyt_array([2.0, 2.0], units=kpc)
point_source = PointSource(offset=offset, cosmo=cosmo, redshift=redshift)

pt_density_grid = point_source.get_density_grid(resolution, npix)

# Plot figure
plt.imshow(pt_density_grid)
plt.xlabel("X Axis (kpc)")
plt.ylabel("Y Axis (kpc)")
plt.title("Example Point Source")
plt.show()


# 2D Sersic example usage

# Define Sersic profile and density grid
sersic = Sersic2D(
    r_eff=5 * kpc,
    theta=45,
    ellipticity=0.2,
    cosmo=cosmo,
    redshift=redshift,
    sersic_index=1,
)

sersic_density_grid = sersic.get_density_grid(resolution, npix)


# Plot figure
plt.contourf(xx, yy, sersic_density_grid, levels=50)
plt.colorbar(label="Luminosity Density")
plt.title("Example Sersic Profile")
plt.xlabel("X Axis (kpc)")
plt.ylabel("Y Axis (kpc)")
plt.show()
Total running time of the script: (0 minutes 0.158 seconds)