Note
Go to the end to download the full example code.
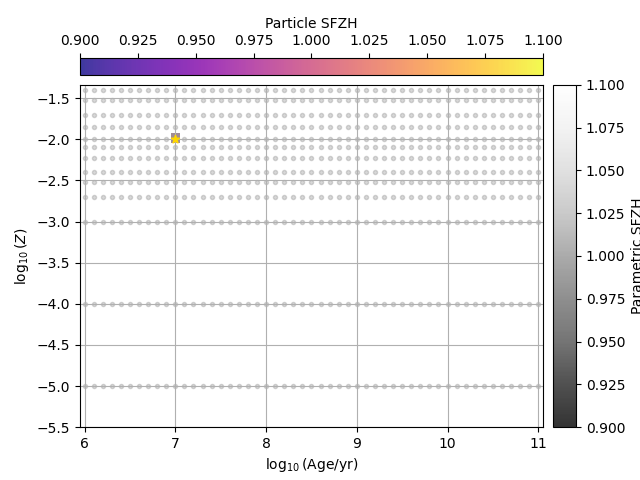
Compare Single star particle to instantaneous SFZH
A sanity check example for a single star in both parametric and particle objects. These should give indistinguishable results.
import matplotlib.pyplot as plt
import numpy as np
from matplotlib.colors import Normalize
from mpl_toolkits.axes_grid1 import make_axes_locatable
from unyt import Msun, yr
from synthesizer.emission_models import TransmittedEmission
from synthesizer.grid import Grid
from synthesizer.parametric import Stars as ParametricStars
from synthesizer.particle import Stars as ParticleStars
# Define the grid
grid_name = "test_grid"
grid_dir = "../../tests/test_grid/"
grid = Grid(grid_name, grid_dir=grid_dir)
# Define the emission model
model = TransmittedEmission(grid)
# Define the parametric stars
stars = ParametricStars(
grid.log10age,
grid.metallicity,
sf_hist=1e7,
metal_dist=0.01,
initial_mass=1 * Msun,
)
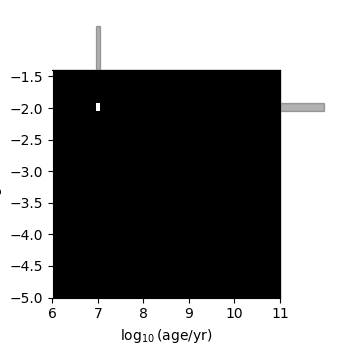
# Plot the SFZH
stars.plot_sfzh()
# Compute the parametric sed
sed = stars.get_spectra(model)
# Create the particle stars object
part_stars = ParticleStars(
initial_masses=np.array([1.0]) * Msun,
ages=np.array([1e7]) * yr,
metallicities=np.array([0.01]),
)
# Calculate the particle SFZH grid (equivalent to grid weights)
part_sfzh = part_stars.get_sfzh(
log10ages=grid.log10age,
metallicities=grid.metallicity,
grid_assignment_method="cic",
).sfzh
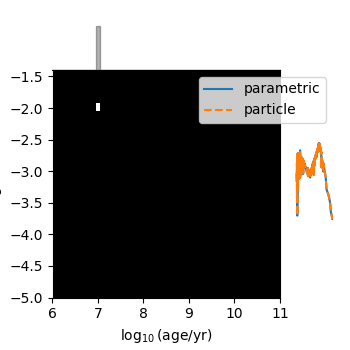
# Plot the SFZH
part_stars.plot_sfzh()
# Create the figure and axes for the comparison
fig, ax = plt.subplots()
ax.grid(True)
# Plot the grid points
x, y = np.meshgrid(grid.log10age, grid.metallicity)
ax.scatter(
x.flatten(),
np.log10(y.flatten()),
marker=".",
color="grey",
alpha=0.3,
)
# Plot the stellar particle properties
ax.scatter(
part_stars.log10ages,
part_stars.log10metallicities,
marker="*",
zorder=10,
color="gold",
)
# Plot the particle SFZH
plt_part_sfzh = np.full_like(part_sfzh, np.nan)
plt_part_sfzh[part_sfzh > 0] = part_sfzh[part_sfzh > 0]
pcm2 = ax.pcolormesh(
grid.log10age,
np.log10(grid.metallicity),
plt_part_sfzh.T,
cmap="plasma",
norm=Normalize(vmin=np.min(part_sfzh[part_sfzh > 0]), vmax=1.0, clip=True),
alpha=0.8,
)
# Plot the parametric SFZH
plt_para_sfzh = np.full_like(stars.sfzh, np.nan)
plt_para_sfzh[stars.sfzh > 0] = stars.sfzh[stars.sfzh > 0]
pcm1 = ax.pcolormesh(
grid.log10age,
np.log10(grid.metallicity),
plt_para_sfzh.T,
cmap="Greys_r",
alpha=0.8,
norm=Normalize(
vmin=np.min(stars.sfzh[stars.sfzh > 0]), vmax=1.0, clip=True
),
)
# Create colorbars on the right for each mesh
divider = make_axes_locatable(ax)
cax1 = divider.append_axes("right", size="5%", pad=0.1)
cbar1 = fig.colorbar(pcm1, cax=cax1, label="Parametric SFZH")
# Create colorbars on the top for each mesh
cax2 = divider.append_axes("top", size="5%", pad=0.1)
cbar2 = plt.colorbar(
pcm2,
cax=cax2,
orientation="horizontal",
label="Particle SFZH",
ticklocation="top",
)
# Label axes
ax.set_xlabel(r"$\log_{10}(\mathrm{Age}/\mathrm{yr})$")
ax.set_ylabel(r"$\log_{10}(Z)$")
plt.show()
part_sed = part_stars.get_spectra(model, grid_assignment_method="cic")
plt.figure(2)
plt.plot(np.log10(sed.lam), np.log10(sed.lnu), label="parametric")
plt.plot(
np.log10(part_sed.lam),
np.log10(part_sed.lnu),
label="particle",
linestyle="--",
)
plt.legend()
plt.xlim([2, 5])
plt.ylim([18, 22])
plt.show()
Total running time of the script: (0 minutes 0.660 seconds)