Note
Go to the end to download the full example code.
Compare different parametric star formation history models
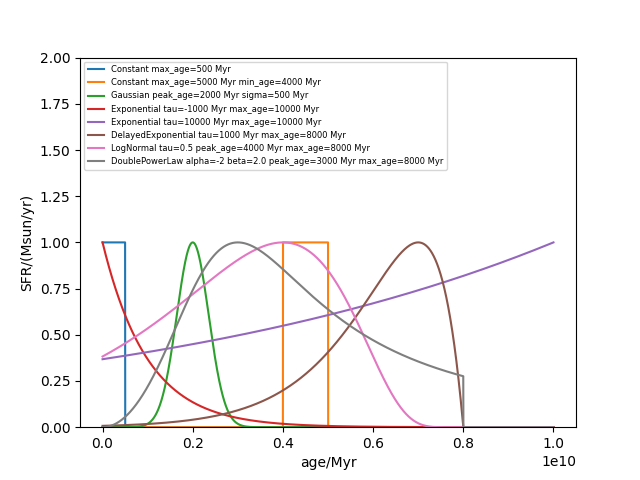
Example comparing different parametric star formation histories.

import matplotlib.pyplot as plt
import numpy as np
from unyt import Myr

from synthesizer.parametric.sf_hist import (
    Constant,
    DelayedExponential,
    DoublePowerLaw,
    Exponential,
    Gaussian,
    LogNormal,
)

models = [
    [Constant, {"max_age": 500 * Myr}],
    [Constant, {"max_age": 5000 * Myr, "min_age": 4000 * Myr}],
    [Gaussian, {"peak_age": 2000 * Myr, "sigma": 500 * Myr}],
    [Exponential, {"tau": -1000 * Myr, "max_age": 10000 * Myr}],
    [Exponential, {"tau": 10000 * Myr, "max_age": 10000 * Myr}],
    [DelayedExponential, {"tau": 1000 * Myr, "max_age": 8000 * Myr}],
    [LogNormal, {"tau": 0.5, "peak_age": 4000 * Myr, "max_age": 8000 * Myr}],
    [
        DoublePowerLaw,
        {
            "alpha": -2,
            "beta": 2.0,
            "peak_age": 3000 * Myr,
            "max_age": 8000 * Myr,
        },
    ],
]


for model, p in models:
    # initialise SFH model
    sfh = model(**p)

    # get star formation history
    age, sfr = sfh.calculate_sfh()

    # normalise to the peak
    sfr = sfr / np.max(sfr)

    # express the parameters as a string for use in a label
    parameter_str = " ".join([f"{k}={v}" for k, v in p.items()])

    # make label
    label = rf"{model.__name__} " + parameter_str

    plt.plot(age, sfr, label=label)

plt.ylim([0, 2])
plt.xlabel("age/Myr")
plt.ylabel("SFR/(Msun/yr)")
plt.legend(loc="upper left", fontsize=6)
plt.show()
Total running time of the script: (0 minutes 0.455 seconds)