Property maps
Synthesizer provides helper methods for making commonly used maps of physical properties. Unlike the methods used to make collections of photometric images, these map making methods return individual Image objects. Like the Galaxy.get_imgs_luminosity and Galaxy.get_imgs_flux methods, these methods take an img_type argument, which can either be "smoothed" or "hist". Below are examples showing their use.
Note that some of these are summative (e.g. mass) while others are mass weighted averages (e.g. metallicity and age).
To plot them we can use the plot_map helper functions, which can optionally include a colorbar, unlike plot_image.
Here we demonstrate the usage of these map methods, but to do so we need a galaxy to visualise. For this we will use an example CAMELS galaxy.
[1]:
import matplotlib.pyplot as plt
import numpy as np
from unyt import Myr, kpc

from synthesizer.imaging import Image
from synthesizer.kernel_functions import Kernel
from synthesizer.load_data.load_camels import load_CAMELS_IllustrisTNG

# Create galaxy object
gal = load_CAMELS_IllustrisTNG(
    "../../../tests/data/",
    snap_name="camels_snap.hdf5",
    group_name="camels_subhalo.hdf5",
    physical=True,
)[1]
/opt/hostedtoolcache/Python/3.10.16/x64/lib/python3.10/site-packages/unyt/array.py:1949: RuntimeWarning: invalid value encountered in divide
  out_arr = func(
We also need to define a resolution and a FOV for the maps, and for the smoothed maps we will need a kernel to be defined.
[2]:
# Define the width of the image
width = 30 * kpc

# Define image resolution (here we arbitrarily set it to
# 200 pixels along an axis)
resolution = width / 200

print(
    "Map width is %.2f kpc with %.2f kpc resolution"
    % (width.value, resolution.value)
)

# Get the SPH kernel
sph_kernel = Kernel()
kernel_data = sph_kernel.get_kernel()
Map width is 30.00 kpc with 0.15 kpc resolution
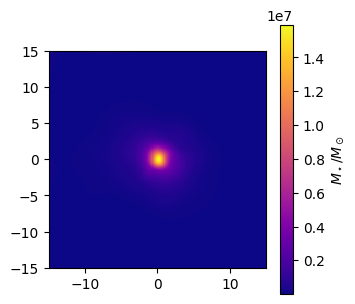
Stellar Mass maps
Note that gas maps are also available.
[3]:
# Make the stellar mass map
stellar_mass_map = gal.get_map_stellar_mass(
    resolution=resolution,
    fov=width,
    img_type="smoothed",
    kernel=kernel_data,
    kernel_threshold=1,
)

fig, ax = stellar_mass_map.plot_map(
    show=True,
    cmap="plasma",
    extent=[-15, 15, -15, 15],
    cbar_label=r"$M_\star/M_\odot$",
)
plt.close(fig)
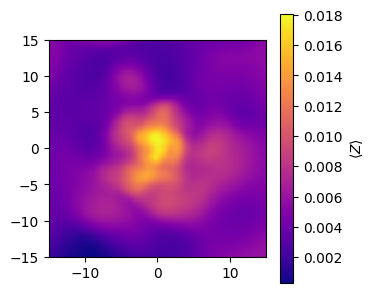
Metallicity maps
For metallicity we can either plot the average metallicity in a pixel or the total metal mass in a pixel.
[4]:
# Make the average stellar metallicity map
metallicity_map = gal.get_map_stellar_metallicity(
resolution=resolution,
fov=width,
img_type="smoothed",
kernel=kernel_data,
kernel_threshold=1,
)
fig, ax = metallicity_map.plot_map(
show=True,
cmap="plasma",
extent=[-15, 15, -15, 15],
cbar_label=r"$\langle Z \rangle $",
)
plt.close(fig)
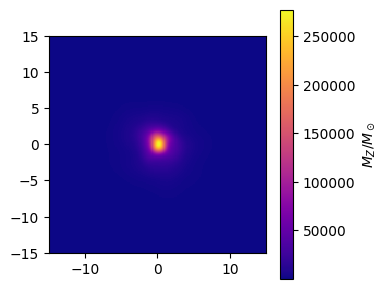
# Make the stellar metal mass map
metal_map = gal.get_map_stellar_metal_mass(
resolution=resolution,
fov=width,
img_type="smoothed",
kernel=kernel_data,
kernel_threshold=1,
)
fig, ax = metal_map.plot_map(
show=True,
cmap="plasma",
extent=[-15, 15, -15, 15],
cbar_label=r"$M_Z/M_\odot$",
)
plt.close(fig)
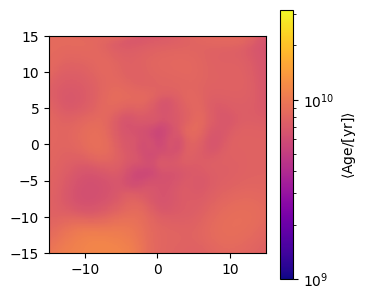
Age maps
We can plot the average age in a pixel. Note that we can provide a normalisation function to the plotting method to scale our colormap.
[5]:
from matplotlib.colors import LogNorm, Normalize

# Make the stellar age map
age_map = gal.get_map_stellar_age(
    resolution=resolution,
    fov=width,
    img_type="smoothed",
    kernel=kernel_data,
    kernel_threshold=1,
)

# Set up a normalisation
norm = LogNorm(vmin=10**9, vmax=10**10.5, clip=True)

fig, ax = age_map.plot_map(
    show=True,
    cmap="plasma",
    extent=[-15, 15, -15, 15],
    cbar_label=r"$\langle \mathrm{Age} / [\mathrm{yr}] \rangle$",
    norm=norm,
)
plt.close(fig)
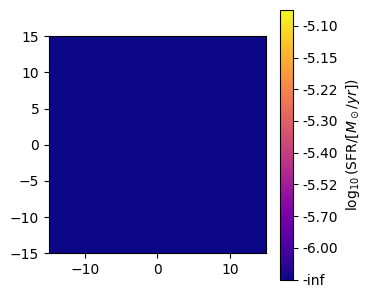
SFR maps
By taking all the recently formed stars (those younger than age_bin) we can plot SFR maps. By default age_bin is 100 Myrs.
Note that for this example the SFR maps are not particuarly exciting since this is a relatively quiescent galaxy.
We can also pass plot_map a tick_formatter to format the color bar ticks however we desire.
[6]:
from matplotlib.ticker import FuncFormatter

# Make the SFR map
sfr_map = gal.get_map_sfr(
    resolution=resolution,
    fov=width,
    img_type="smoothed",
    kernel=kernel_data,
    kernel_threshold=1,
    age_bin=100 * Myr,
)

# Set up a normalisation
norm = Normalize(vmin=None, vmax=8.5 * 10**-6, clip=True)

# Set up the tick formatter
tick_formatter = FuncFormatter(lambda x, tick_pos: f"{np.log10(x):.2f}")

fig, ax = sfr_map.plot_map(
    show=True,
    cmap="plasma",
    extent=[-15, 15, -15, 15],
    cbar_label=r"$\log_{10}(\mathrm{SFR} / [M_\odot/yr])$",
    norm=norm,
    tick_formatter=tick_formatter,
)
plt.close(fig)
/tmp/ipykernel_4593/266430933.py:4: RuntimeWarning: The SFR is 0! (there are 0 stars in the age bin)
  sfr_map = gal.get_map_sfr(
/tmp/ipykernel_4593/266430933.py:17: RuntimeWarning: divide by zero encountered in log10
  tick_formatter = FuncFormatter(lambda x, tick_pos: f"{np.log10(x):.2f}")
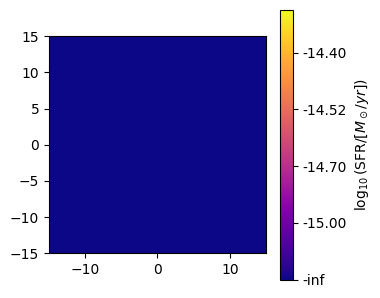
sSFR maps
[7]:
# Make the sSFR map
ssfr_map = gal.get_map_ssfr(
    resolution=resolution,
    fov=width,
    img_type="smoothed",
    kernel=kernel_data,
    kernel_threshold=1,
)

# Set up a normalisation
norm = Normalize(vmin=None, vmax=4.75 * 10**-15, clip=True)

fig, ax = ssfr_map.plot_map(
    show=True,
    cmap="plasma",
    extent=[-15, 15, -15, 15],
    cbar_label=r"$\log_{10}(\mathrm{SFR} / [M_\odot/yr])$",
    norm=norm,
    tick_formatter=tick_formatter,
)
plt.close(fig)
/home/runner/work/synthesizer/synthesizer/src/synthesizer/particle/galaxy.py:1436: RuntimeWarning: The SFR is 0! (there are 0 stars in the age bin)
  img = self.get_map_sfr(
/tmp/ipykernel_4593/266430933.py:17: RuntimeWarning: divide by zero encountered in log10
  tick_formatter = FuncFormatter(lambda x, tick_pos: f"{np.log10(x):.2f}")
Making your own map
We haven’t made every concievable property or combination of properties into a map method. Should you want to make your own map this easily be achieved using Image objects.
First you need to instantiate an image to hold your map with the resolution and FOV.
[8]:
# Get the image instance
img = Image(resolution, fov=width)
With the image in hand you need only call the image creation method you want to use: get_img_hist for a histogram or get_img_smoothed for a smoothed image. These methods take a signal argument, in addition to the coordinates (and smoothing lengths and kernel arguments in the smoothed case). This signal is the value that will be sorted / smoothed into pixels. You can pass any particle property for this signal, or indeed any combination of properties.
For a weighted image you can define multiple images, and then divide one by the other to remove the weighting. This is what is done inside the helper methods above.
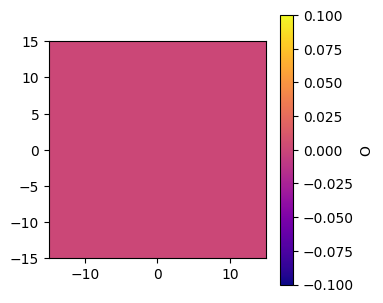
As an example, below we demonstrate making a map of relative oxygen abundance.
[9]:
# Get an image of the gas dust-to-metal ratio
img.get_img_smoothed(
    signal=gal.stars.s_oxygen,
    coordinates=gal.stars.coordinates,
    smoothing_lengths=gal.stars.smoothing_lengths,
    kernel=kernel_data,
    kernel_threshold=1,
)

fig, ax = img.plot_map(
    show=True,
    cmap="plasma",
    extent=[-15, 15, -15, 15],
    cbar_label="O",
)