synthesizer.sed
Functionality related to spectra storage and manipulation.
When a spectra is computed from a Galaxy or a Galaxy component the resulting calculated spectra are stored in Sed objects. These provide helper functions for quick manipulation of the spectra. Seds can contain a single spectra or arbitrarily many, with all methods capable of acting on both consistently.
Example usage:
sed = Sed(lams, lnu) sed.get_fnu(redshift) sed.apply_attenutation(tau_v=0.7) sed.get_photo_fnu(filters, nthreads=4)
Functions
- synthesizer.sed.combine_list_of_seds(sed_list)[source]
Combine a list of Sed objects (length Ngal) into a single Sed object, with dimensions Ngal x Nlam. Each Sed object in the list should have an identical wavelength range.
- Parameters:
sed_list (list) – list of Sed objects
- synthesizer.sed.get_attenuation(intrinsic_sed, attenuated_sed)[source]
Calculate attenuation as a function of wavelength
- synthesizer.sed.get_attenuation_at_1500(intrinsic_sed, attenuated_sed)[source]
Calculate rest-frame FUV attenuation at 1500 angstrom.
- synthesizer.sed.get_attenuation_at_5500(intrinsic_sed, attenuated_sed)[source]
Calculate rest-frame FUV attenuation at 5500 angstrom.
- synthesizer.sed.get_attenuation_at_lam(lam, intrinsic_sed, attenuated_sed)[source]
Calculate attenuation at a given wavelength
- Parameters:
- Returns:
- float/array-like, float
The attenuation at the passed wavelength/s in magnitudes.
- synthesizer.sed.get_transmission(intrinsic_sed, attenuated_sed)[source]
Calculate transmission as a function of wavelength from an attenuated and an intrinsic sed.
- synthesizer.sed.plot_observed_spectra(spectra, redshift, fig=None, ax=None, show=False, ylimits=(), xlimits=(), figsize=(3.5, 5), label=None, draw_legend=True, x_units=None, y_units=None, filters=None, quantity_to_plot='fnu')[source]
Plots either a specific observed spectra or all observed spectra provided in a dictionary.
This function is a wrapper around plot_spectra.
This is a generic plotting function to be used either directly or to be wrapped by helper methods through Synthesizer.
- Parameters:
spectra (dict/Sed) – The Sed objects from which to plot. This can either be a dictionary of Sed objects to plot multiple or a single Sed object to only plot one.
redshift (float) – The redshift of the observation.
fig (matplotlib.pyplot.figure) – The figure containing the axis. By default one is created in this function.
ax (matplotlib.axes) – The axis to plot the data on. By default one is created in this function.
show (bool) – Flag for whether to show the plot or just return the figure and axes.
ylimits (tuple) – The limits to apply to the y axis. If not provided the limits will be calculated with the lower limit set to 1000 (100) times less than the peak of the spectrum for rest_frame (observed) spectra.
xlimits (tuple) – The limits to apply to the x axis. If not provided the optimal limits are found based on the ylimits.
figsize (tuple) – Tuple with size 2 defining the figure size.
label (string) – The label to give the spectra. Only applicable when Sed is a single spectra.
draw_legend (bool) – Whether to draw the legend.
x_units (unyt.unit_object.Unit) – The units of the x axis. This will be converted to a string and included in the axis label. By default the internal unit system is assumed unless this is passed.
y_units (unyt.unit_object.Unit) – The units of the y axis. This will be converted to a string and included in the axis label. By default the internal unit system is assumed unless this is passed.
filters (FilterCollection) – If given then the photometry is computed and both the photometry and filter curves are plotted
quantity_to_plot (string) – The sed property to plot. Can be “fnu”, “flam”, or “flux”. Defaults to “fnu”.
- Returns:
- fig (matplotlib.pyplot.figure)
The matplotlib figure object for the plot.
- ax (matplotlib.axes)
The matplotlib axes object containing the plotted data.
- synthesizer.sed.plot_spectra(spectra, fig=None, ax=None, show=False, ylimits=(), xlimits=(), figsize=(3.5, 5), label=None, draw_legend=True, x_units=None, y_units=None, quantity_to_plot='lnu')[source]
Plots either a specific spectra or all spectra provided in a dictionary. The plotted “type” of spectra is defined by the quantity_to_plot keyword arrgument which defaults to “lnu”.
This is a generic plotting function to be used either directly or to be wrapped by helper methods through Synthesizer.
- Parameters:
spectra (dict/Sed) – The Sed objects from which to plot. This can either be a dictionary of Sed objects to plot multiple or a single Sed object to only plot one.
fig (matplotlib.pyplot.figure) – The figure containing the axis. By default one is created in this function.
ax (matplotlib.axes) – The axis to plot the data on. By default one is created in this function.
show (bool) – Flag for whether to show the plot or just return the figure and axes.
ylimits (tuple) – The limits to apply to the y axis. If not provided the limits will be calculated with the lower limit set to 1000 (100) times less than the peak of the spectrum for rest_frame (observed) spectra.
xlimits (tuple) – The limits to apply to the x axis. If not provided the optimal limits are found based on the ylimits.
figsize (tuple) – Tuple with size 2 defining the figure size.
label (string) – The label to give the spectra. Only applicable when Sed is a single spectra.
draw_legend (bool) – Whether to draw the legend.
x_units (unyt.unit_object.Unit) – The units of the x axis. This will be converted to a string and included in the axis label. By default the internal unit system is assumed unless this is passed.
y_units (unyt.unit_object.Unit) – The units of the y axis. This will be converted to a string and included in the axis label. By default the internal unit system is assumed unless this is passed.
quantity_to_plot (string) – The sed property to plot. Can be “lnu”, “luminosity” or “llam” for rest frame spectra or “fnu”, “flam” or “flux” for observed spectra. Defaults to “lnu”.
- Returns:
- fig (matplotlib.pyplot.figure)
The matplotlib figure object for the plot.
- ax (matplotlib.axes)
The matplotlib axes object containing the plotted data.
Examples using synthesizer.sed.plot_spectra
- synthesizer.sed.plot_spectra_as_rainbow(sed, figsize=(5, 0.5), lam_min=3000, lam_max=8000, include_xaxis=True, logged=False, min_log_lnu=-2.0, use_fnu=False)[source]
Create a plot of the spectrum as a rainbow.
- Parameters:
sed (synthesizer.sed.Sed) – A synthesizer Sed object.
figsize (tuple) – Fig-size tuple (width, height).
lam_min (float) – The min wavelength to plot in Angstroms.
lam_max (float) – The max wavelength to plot in Angstroms.
include_xaxis (bool) – Flag whther to include x-axis ticks and label.
logged (bool) – Flag whether to use logged luminosity.
min_log_lnu (float) – Minium luminosity to plot relative to the maximum.
use_fnu (bool) – Whether to plot fluxes or luminosities. If True fluxes are plotted, otherwise luminosities.
- Returns:
- fig (matplotlib.pyplot.figure)
The matplotlib figure object for the plot.
- ax (matplotlib.axes)
The matplotlib axes object containing the plotted data.
Classes
- class synthesizer.sed.Sed(lam, lnu=None, description=None)[source]
A class representing a spectral energy distribution (SED).
- description
An optional descriptive string defining the Sed.
- Type:
string
- redshift
The redshift of the Sed.
- Type:
float
- photo_lnu
The rest frame broadband photometry in arbitrary filters (filter_code: photometry).
- Type:
dict, float
- photo_fnu
The observed broadband photometry in arbitrary filters (filter_code: photometry).
- Type:
dict, float
- apply_attenuation(tau_v, dust_curve, mask=None)[source]
Apply attenuation to spectra.
- Parameters:
tau_v (float/array-like, float) – The V-band optical depth for every star particle.
dust_curve (synthesizer.emission_models.attenuation.*) – An instance of one of the dust attenuation models. (defined in synthesizer/emission_models.attenuation.py)
mask (array-like, bool) – A mask array with an entry for each spectra. Masked out spectra will be ignored when applying the attenuation. Only applicable for Sed’s holding an (N, Nlam) array.
- Returns:
- Sed
A new Sed containing the rest frame spectra of self attenuated by the transmission defined from tau_v and the dust curve.
- property bolometric_luminosity
Return the bolometric luminosity of the SED with units.
This will integrate the SED using the trapezium method over the final axis (which is always the wavelength axis) for an arbitrary number of dimensions.
- Returns:
- bolometric_luminosity (unyt_array)
The bolometric luminosity.
- calculate_ionising_photon_production_rate(ionisation_energy=unyt_quantity(13.6, 'eV'), limit=100, nthreads=1)[source]
Calculate the ionising photon production rate.
- Parameters:
ionisation_energy (unyt_array) – The ionisation energy.
limit (float/int) – An upper bound on the number of subintervals used in the integration adaptive algorithm.
nthreads (int) – The number of threads to use for the integration. If -1 then all available threads are used.
- Returns
- float
Ionising photon luminosity (s^-1).
- concat(*other_seds)[source]
Concatenate the spectra arrays of multiple Sed objects.
This will combine the arrays along the first axis. For example concatenating two Seds with Sed.lnu.shape = (10, 1000) and Sed.lnu.shape = (20, 1000) will result in a new Sed with Sed.lnu.shape = (30, 1000). The wavelength array of the resulting Sed will be the array on self.
Incompatible spectra shapes will raise an error.
- Parameters:
other_seds (object, Sed) – Any number of Sed objects to concatenate with self. These must have the same wavelength array.
- Returns:
- Sed
A new instance of Sed with the concatenated lnu arrays.
- Raises:
InconsistentAddition – If wavelength arrays are incompatible an error is raised.
- property energy
Get the wavelengths in terms of photon energies in eV.
- Returns
- energy (unyt_array)
The energy coordinate.
- property flux
Get the spectra in terms fo flux.
- Returns:
- flux (unyt_array)
The flux array.
- property frequency
Alias to nu (frequency array).
- Returns
- frequency (unyt_array)
The frequency array.
- get_fnu(cosmo, z, igm=None)[source]
Calculate the observed frame spectral energy distribution.
This will also populate the observed wavelength and frequency arrays with the observer frame values.
NOTE: if a redshift of 0 is passed the flux return will be calculated assuming a distance of 10 pc omitting IGM since at this distance IGM contribution makes no sense.
- Parameters:
cosmo (astropy.cosmology) – astropy cosmology instance.
z (float) – The redshift of the spectra.
igm (igm) – The IGM class. e.g. synthesizer.igm.Inoue14. Defaults to None.
- Returns:
- fnu (ndarray)
Spectral flux density calcualted at d=10 pc
- get_fnu0()[source]
Calculate the rest frame spectral flux density.
Uses a standard distance of 10 pcs.
This will also populate the observed wavelength and frequency arrays which in this case are the same as the emitted arrays.
- Returns:
- fnu (ndarray)
Spectral flux density calcualted at d=10 pc.
- get_lnu_at_lam(lam, kind=False)[source]
Return lnu at a provided wavelength.
- Parameters:
lam (float/array-like, float) – The wavelength(s) of interest.
kind (str) – Interpolation kind, see scipy.interp1d docs for more information. Possible values are ‘linear’, ‘nearest’, ‘zero’, ‘slinear’, ‘quadratic’, ‘cubic’, ‘previous’, and ‘next’.
- Returns:
- luminosity (unyt-array)
The luminosity (lnu) at the provided wavelength.
- get_lnu_at_nu(nu, kind=False)[source]
Return lnu with units at a provided frequency using 1d interpolation.
- Parameters:
wavelength (float/array-like, float) – The wavelength(s) of interest.
kind (str) – Interpolation kind, see scipy.interp1d docs for more information. Possible values are ‘linear’, ‘nearest’, ‘zero’, ‘slinear’, ‘quadratic’, ‘cubic’, ‘previous’, and ‘next’.
- Returns:
- luminosity (unyt_array)
The luminosity (lnu) at the provided wavelength.
- get_photo_fnu(filters, verbose=True, nthreads=1)[source]
Calculate broadband fluxes using a FilterCollection object.
- Parameters:
filters (object) – A FilterCollection object.
verbose (bool) – Are we talking?
nthreads (int) – The number of threads to use for the integration. If -1 then all available threads are used.
- Returns:
- (dict)
A dictionary of fluxes in each filter in filters.
- get_photo_lnu(filters, verbose=True, nthreads=1)[source]
Calculate broadband luminosities using a FilterCollection object.
- Parameters:
filters (filters.FilterCollection) – A FilterCollection object.
verbose (bool) – Are we talking?
nthreads (int) – The number of threads to use for the integration. If -1 then all available threads are used.
- Returns:
- photo_lnu (dict)
A dictionary of rest frame broadband luminosities.
- get_resampled_sed(resample_factor=None, new_lam=None)[source]
Resample the spectra onto a new set of wavelength points.
This resampling can either be done by an integer number of wavelength elements per original wavelength element (i.e. up sampling), or by providing a new wavelength grid to resample on to.
- Parameters:
resample_factor (int) – The number of additional wavelength elements to resample to.
new_lam (array-like, float) – The wavelength array to resample onto.
- Returns:
- Sed
A new Sed with the rebinned rest frame spectra.
- Raises:
InconsistentArgument – Either resample factor or new_lam must be supplied. If neither or both are passed an error is raised.
- property llam
Get the spectral luminosity density per Angstrom.
- Returns
- luminosity (unyt_array)
The spectral luminosity density per Angstrom array.
- property luminosity
Get the spectra in terms of luminosity.
- Returns
- luminosity (unyt_array)
The luminosity array.
- property luminosity_lambda
Alias to llam.
- Returns
- luminosity (unyt_array)
The spectral luminosity density per Angstrom array.
- property luminosity_nu
Alias to lnu.
- Returns
- luminosity (unyt_array)
The spectral luminosity density per Hz array.
- measure_balmer_break(nthreads=1, integration_method='trapz')[source]
Measure the Balmer break.
This will use two windows at (3400,3600) and (4150,4250).
- Parameters:
nthreads (int) – The number of threads to use for the integration. If -1 then all available threads are used.
integration_method (str) – The integration method used. Options include ‘trapz’ and ‘simps’.
- Returns:
- float
The Balmer break strength
- Raises:
UnrecognisedOption – If integration_method is an incompatible option an error is raised.
- measure_beta(window=(unyt_quantity(1250., 'Å'), unyt_quantity(3000., 'Å')), nthreads=1, integration_method='trapz')[source]
Measure the UV continuum slope (beta).
If the provided window is len(2) a full fit to the spectra is performed otherwise the luminosity in two windows is calculated and used to determine the slope, similar to observations.
- Parameters:
window (tuple, float) – The window in which to measure in terms of wavelength.
nthreads (int) – The number of threads to use for the integration. If -1 then all available threads are used.
integration_method (str) – The integration method used to calculate the window luminosity. Options include ‘trapz’ and ‘simps’.
- Returns:
- float
The UV continuum slope (beta)
- Raises:
UnrecognisedOption – If integration_method is an incompatible option an error is raised.
- measure_break(blue, red, nthreads=1, integration_method='trapz')[source]
Measure a spectral break (e.g. the Balmer break) using two windows.
- Parameters:
blue (tuple, float) – The wavelength limits of the blue window.
red (tuple, float) – The wavelength limits of the red window.
nthreads (int) – The number of threads to use for the integration. If -1 then all available threads are used.
integration_method (str) – The integration method used. Options include ‘trapz’ and ‘simps’.
- Returns:
- break
The ratio of the luminosity in the two windows.
- Raises:
UnrecognisedOption – If integration_method is an incompatible option an error is raised.
- measure_colour(f1, f2)[source]
Measure a broadband colour.
- Parameters:
f1 (str) – The blue filter code.
f2 (str) – The red filter code.
- Returns:
- (float)
The broadband colour.
- measure_d4000(definition='Bruzual83', nthreads=1, integration_method='trapz')[source]
Measure the D4000 index.
This can optionally use either the Bruzual83 or Balogh definitions.
- Parameters:
definition – The choice of definition: ‘Bruzual83’ or ‘Balogh’.
nthreads (int) – The number of threads to use for the integration. If -1 then all available threads are used.
integration_method (str) – The integration method used. Options include ‘trapz’ and ‘simps’.
- Returns:
- float
The Balmer break strength.
- Raises:
- UnrecognisedOption
If definition or integration_method is an incompatible option an error is raised.
- measure_index(feature, blue, red)[source]
Measure an absorption feature index.
- Parameters:
feature (tuple) – Absorption feature window.
blue (tuple) – Blue continuum window for fitting.
red (tuple) – Red continuum window for fitting.
- Returns:
- index (float)
Absorption feature index in units of wavelength
- measure_window_lnu(window, integration_method='trapz', nthreads=1)[source]
Measure lnu in a spectral window.
- Parameters:
window (tuple, float) – The window in wavelength.
integration_method (str) – The integration method to use on the window. Options include ‘average’, or for integration ‘trapz’, and ‘simps’.
nthreads (int) – The number of threads to use for the integration. If -1 then all available threads are used.
- Returns:
- luminosity (float)
The luminosity in the window.
- Raises:
- UnrecognisedOption
If integration_method is an incompatible option an error is raised.
- measure_window_luminosity(window, integration_method='trapz', nthreads=1)[source]
Measure the luminosity in a spectral window.
- Parameters:
window (tuple, float) – The window in wavelength.
integration_method (str) – The integration method used to calculate the window luminosity. Options include ‘trapz’ and ‘simps’.
nthreads (int) – The number of threads to use for the integration. If -1 then all available threads are used.
- Returns:
- luminosity (float)
The luminosity in the window.
- Raises:
UnrecognisedOption – If integration_method is an incompatible option an error is raised.
- property ndim
Get the dimensions of the spectra array.
- Returns
- Tuple
The shape of self.lnu
- plot_observed_spectra(**kwargs)[source]
Plot the observed spectra.
A wrapper for synthesizer.sed.plot_observed_spectra()
- plot_spectra_as_rainbow(**kwargs)[source]
Plot the spectra as a rainbow.
A wrapper for synthesizer.sed.plot_spectra_as_rainbow()
- property shape
Get the shape of the spectra array.
- Returns
- Tuple
The shape of self.lnu
- sum()[source]
For multidimensional sed’s, sum the luminosity to provide a 1D integrated SED.
- Returns:
- sed (object, Sed)
Summed 1D SED.
- property wavelength
Alias to lam (wavelength array).
- Returns
- wavelength (unyt_array)
The wavelength array.
Examples using synthesizer.sed.Sed


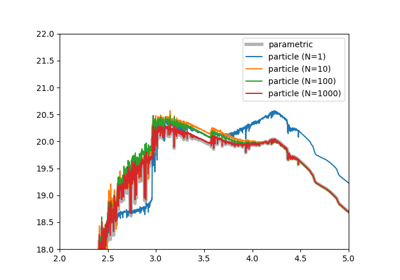
Compare Single star particle to instantaneous SFZH