Note
Go to the end to download the full example code.
Plot spectra by age
This example plots all the spectra for a single metallicity.
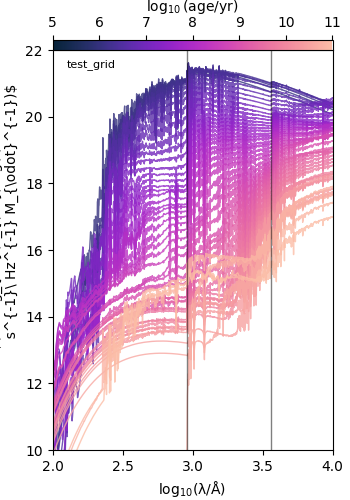
test_grid
target metallicity: 0.01
metallicity: 0.01 dimensionless
import argparse
import glob
import os

import cmasher as cmr
import matplotlib as mpl
import matplotlib.cm as cm
import matplotlib.pyplot as plt
import numpy as np

from synthesizer.grid import Grid

# colourmap to use
cmap = cmr.bubblegum

# mapping of age to colour
norm = mpl.colors.Normalize(vmin=5.0, vmax=11.0)


def plot_spectra_age(grid, target_Z, spec_name="incident"):
    # get closest metallicity grid point
    grid_point = grid.get_grid_point(
        log10ages=grid.log10age[0],
        metallicity=target_Z,
    )
    # metallicity grid point
    iZ = grid_point[1]

    # get actual metallicity for that grid point and print it
    Z = grid.metallicity[iZ]
    print(f"target metallicity: {target_Z:.2f}")
    print(f"metallicity: {Z:.2f}")

    # initialise plot
    fig = plt.figure(figsize=(3.5, 5.0))

    left = 0.15
    height = 0.8
    bottom = 0.1
    width = 0.8

    # define main ax
    ax = fig.add_axes((left, bottom, width, height))

    # define colourbar ax
    cax = fig.add_axes((left, bottom + height, width, 0.02))

    # add colourbar
    fig.colorbar(
        cm.ScalarMappable(norm=norm, cmap=cmap),
        cax=cax,
        orientation="horizontal",
    )

    # colourbar formatting and labelling
    cax.xaxis.tick_top()
    cax.xaxis.set_label_position("top")
    cax.set_xlabel(r"$\rm \log_{10}(age/yr)$")

    # loop over log10ages
    for ia, log10age in enumerate(grid.log10age):
        # get spectra
        Lnu = grid.spectra[spec_name][ia, iZ, :]
        # Lnu = fnu_to_flam(grid.lam, Lnu)

        # plot spectra
        ax.plot(
            np.log10(grid.lam),
            np.log10(Lnu),
            c=cmap(norm(log10age)),
            lw=1,
            alpha=0.8,
        )

    # plot Lyman and Balmer limits for reference
    for wv in [912.0, 3646.0]:
        ax.axvline(np.log10(wv), c="k", lw=1, alpha=0.5)

    # add model name
    ax.text(2.1, 21.5, grid.grid_name, fontsize=8)

    # set wavelength range (log(Angstrom))
    ax.set_xlim([2.0, 4.0])

    # set luminosity range
    ax.set_ylim([10.0, 22])

    # add labels
    ax.set_xlabel(r"$\rm log_{10}(\lambda/\AA)$")
    ax.set_ylabel(
        r"$\rm log_{10}(L_{\nu}/erg\ \
                  s^{-1}\ Hz^{-1} M_{\odot}^{-1})$"
    )

    # return figure and axes for further use
    return fig, ax


if __name__ == "__main__":
    # Get the location of this script, __file__ is the absolute path of this
    # script, however we just want to directory
    # script_path = os.path.abspath(os.path.dirname(__file__))

    # Define the path to the test grid
    # test_grid_dir = script_path + "/../../tests/test_grid/"
    test_grid_dir = "../../tests/test_grid/"

    parser = argparse.ArgumentParser(
        description=(
            "Create a plot of all spectra for a given metallicity in \
                     a grid"
        )
    )

    # The name of the grid. Defaults to the test grid.
    parser.add_argument(
        "-grid_name",
        "--grid_name",
        type=str,
        required=False,
        default="test_grid",
    )

    # The path to the grid directory. Defaults to the test grid directory.
    parser.add_argument(
        "-grid_dir",
        "--grid_dir",
        type=str,
        required=False,
        default=test_grid_dir,
    )

    # The target metallicity. The code function will find the closest
    # metallicity and report it back. The rationale behind this is that this
    # code can easily be adapted to explore other grids.
    parser.add_argument("-Z", "--Z", type=float, required=False, default=0.01)

    # Flag whether to show the figure. Figure is saved in current
    # directory using "spectra_age_{grid_name}"
    parser.add_argument(
        "-show", "--show", action=argparse.BooleanOptionalAction
    )

    # Flag whether to save the figure.
    parser.add_argument(
        "-save", "--save", action=argparse.BooleanOptionalAction
    )

    # Flag whether to analyse all grids in the provided directory.
    parser.add_argument("-all", "--all", action=argparse.BooleanOptionalAction)

    # Get dictionary of arguments
    args = parser.parse_args()

    # If all grids are requested get a list of the grids in the grid_dir
    # directory.
    if args.all:
        grid_filenames = list(
            map(os.path.basename, glob.glob(args.grid_dir + "*.hdf5"))
        )

        print(grid_filenames)

        # Remove extension
        grid_names = list(
            map(lambda x: ".".join(x.split(".")[:-1]), grid_filenames)
        )

        print(grid_names)

    # Else use the provided grid name
    else:
        grid_names = [args.grid_name]

    # loop over all grid_names
    for grid_name in grid_names:
        print(grid_name)

        # Initialise grid
        grid = Grid(grid_name, grid_dir=args.grid_dir)

        # Create figure
        fig, ax = plot_spectra_age(grid, args.Z)

        # show figure if requested
        if args.show:
            plt.show()

        # save figure if requested
        if args.save:
            fig.savefig(f"spectra_age_{grid_name}.pdf")
Total running time of the script: (0 minutes 0.513 seconds)