Note
Go to the end to download the full example code.
Plot spectra example
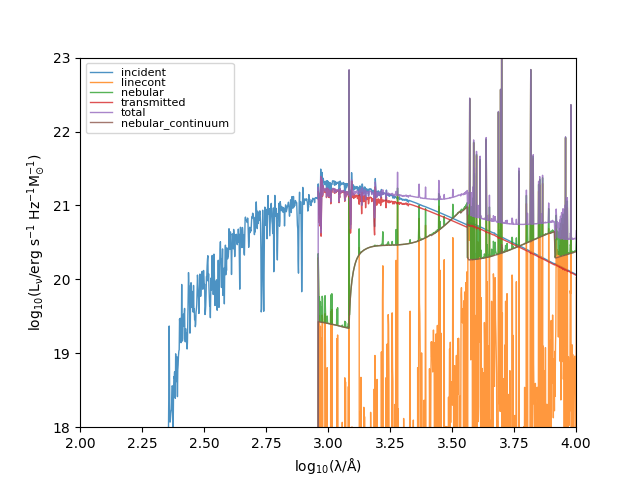
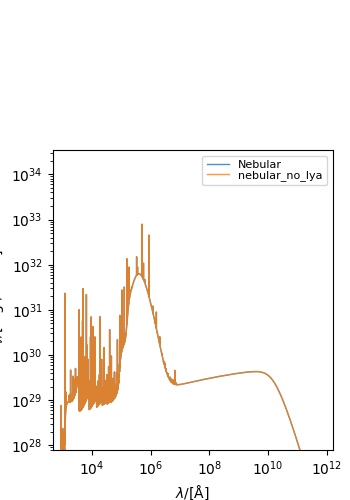
This example demonstrates how to generate spectra for a parametric galaxy using a Pacman emission model and plot the spectra. It also shows the impact of varying a number of parameters in the emission model, such as the lyman-alpha escape fraction.
import argparse

import matplotlib.pyplot as plt
from unyt import Msun, Myr

from synthesizer.emission_models import PacmanEmission
from synthesizer.grid import Grid
from synthesizer.parametric import SFH, Stars, ZDist
from synthesizer.parametric.galaxy import Galaxy
from synthesizer.sed import plot_spectra

if __name__ == "__main__":
    # Get the location of this script, __file__ is the absolute path of this
    # script, however we just want to directory
    # script_path = os.path.abspath(os.path.dirname(__file__))

    # define the test grid dir
    # test_grid_dir = script_path + "/../../tests/test_grid/"
    test_grid_dir = "../../tests/test_grid/"

    # initialise argument parser
    parser = argparse.ArgumentParser(
        description=(
            "Create a plot of all spectra types for a given metallicity and \
            age"
        )
    )

    # The name of the grid. Defaults to the test grid.
    parser.add_argument(
        "-grid_name",
        "--grid_name",
        type=str,
        required=False,
        default="test_grid",
    )

    # The path to the grid directory. Defaults to the test grid directory.
    parser.add_argument(
        "-grid_dir",
        "--grid_dir",
        type=str,
        required=False,
        default=test_grid_dir,
    )

    # Get dictionary of arguments
    args = parser.parse_args()

    # initialise grid
    grid = Grid(args.grid_name, grid_dir=args.grid_dir)

    # define the parameters of the star formation and metal
    # enrichment histories
    sfh_p = {"max_age": 10 * Myr}
    Z_p = {
        "log10metallicity": -2.0
    }  # can also use linear metallicity e.g. {'Z': 0.01}
    stellar_mass = 1e9 * Msun

    # define the functional form of the star formation and metal
    # enrichment histories
    sfh = SFH.Constant(**sfh_p)  # constant star formation
    metal_dist = ZDist.DeltaConstant(**Z_p)  # constant metallicity

    # get the 2D star formation and metal enrichment history for the given
    # SPS grid. This is (age, Z).
    stars = Stars(
        grid.log10age,
        grid.metallicity,
        sf_hist=sfh,
        metal_dist=metal_dist,
        initial_mass=stellar_mass,
    )

    # Create a galaxy object
    galaxy = Galaxy(stars)

    # Define the emission model
    model = PacmanEmission(
        grid,
        tau_v=0.1,
        fesc=0.0,
        fesc_ly_alpha=1.0,
    )

    galaxy.stars.get_spectra(model)

    for _spec in [
        "intrinsic",
        "transmitted",
        "nebular",
    ]:
        plt.loglog(
            galaxy.stars.spectra[_spec].lam,
            galaxy.stars.spectra[_spec].lnu,
            label=_spec,
        )

    plt.xlim([7e2, 2e3])
    plt.ylim(1e26, 1e32)
    plt.legend(fontsize=8, labelspacing=0.0)
    plt.xlabel(r"$\rm log_{10}(\lambda/\AA)$")
    plt.ylabel(r"$\rm log_{10}(L_{\nu}/erg\ s^{-1}\ Hz^{-1} M_{\odot}^{-1})$")
    plt.show()

    # Store nebular spectra for comparison
    nebular_spectra = galaxy.stars.spectra["nebular"]

    # Define a new emission model with lyman-alpha escape fraction of zero
    model = PacmanEmission(
        grid,
        tau_v=0.1,
        fesc=0.0,
        fesc_ly_alpha=0.0,
    )

    galaxy.stars.get_spectra(model)

    for _spec in [
        "nebular_line",
        "intrinsic",
        "nebular_continuum",
        "transmitted",
        "nebular",
    ]:
        plt.loglog(
            galaxy.stars.spectra[_spec].lam,
            galaxy.stars.spectra[_spec].lnu,
            label=_spec,
        )

    plt.xlim([7e2, 2e3])
    plt.ylim(1e26, 1e32)
    plt.legend(fontsize=8, labelspacing=0.0)
    plt.xlabel(r"$\rm log_{10}(\lambda/\AA)$")
    plt.ylabel(r"$\rm log_{10}(L_{\nu}/erg\ s^{-1}\ Hz^{-1} M_{\odot}^{-1})$")
    plt.show()

    # Store nebular spectra for comparison
    nebular_spectra_no_lya = galaxy.stars.spectra["nebular"]

    plot_spectra(
        {
            "nebular_no_lya": nebular_spectra_no_lya,
            "nebular": nebular_spectra,
        },
        show=True,
    )
Total running time of the script: (0 minutes 0.824 seconds)

