Lines from Galaxy objects
To generate lines from components of a Galaxy (i.e. parametric or particle based stars or black holes) synthesizer provides get_lines methods on component and galaxy objects. These methods are analogous to those on a grid, and return a LineCollection containing the requested lines (which can either be singular, doublets, triplets, or more).
[1]:
from unyt import Msun, Myr, kelvin

import synthesizer.line_ratios as line_ratios
from synthesizer.emission_models import BimodalPacmanEmission
from synthesizer.emission_models.attenuation import PowerLaw
from synthesizer.emission_models.dust.emission import Blackbody
from synthesizer.grid import Grid
from synthesizer.parametric import SFH, Stars, ZDist

# Get a grid
grid_dir = "../../../tests/test_grid"
grid_name = "test_grid"
grid = Grid(grid_name, grid_dir=grid_dir)

# Make a parametric galaxy
stellar_mass = 10**12 * Msun
sfh = SFH.Constant(max_age=100 * Myr)
metal_dist = ZDist.Normal(mean=0.01, sigma=0.05)
stars = Stars(
    grid.log10age,
    grid.metallicity,
    sf_hist=sfh,
    metal_dist=metal_dist,
    initial_mass=stellar_mass,
)

# Set up the emission model
model = BimodalPacmanEmission(
    grid=grid,
    tau_v_ism=0.5,
    tau_v_birth=0.7,
    dust_curve_ism=PowerLaw(slope=-1.3),
    dust_curve_birth=PowerLaw(slope=-0.7),
    dust_emission_ism=Blackbody(temperature=100 * kelvin),
    dust_emission_birth=Blackbody(temperature=30 * kelvin),
    fesc=0.2,
    fesc_ly_alpha=0.9,
)

# To get the dust emission at a line we need to first run the
# spectra generation
stars.get_spectra(model)

# Get the lines
lines = stars.get_lines(
    (line_ratios.Hb, line_ratios.O3r, line_ratios.O3b), model
)

print(stars.lines["emergent"])
+-------------------------------------------------------------------+
|                          LINECOLLECTION                           |
+------------------+------------------------------------------------+
| Attribute        | Value                                          |
+------------------+------------------------------------------------+
| nlines           | 3                                              |
+------------------+------------------------------------------------+
| available_ratios | [R3, ]                                         |
+------------------+------------------------------------------------+
| line_ids         | ['H 1 4861.32A' 'O 3 4958.91A' 'O 3 5006.84A'] |
+------------------+------------------------------------------------+
| wavelengths      | [4861.32 4958.91 5006.84] Å                    |
+------------------+------------------------------------------------+
| lines            | H 1 4861.32A: Line                             |
|                  | O 3 5006.84A: Line                             |
|                  | O 3 4958.91A: Line                             |
+------------------+------------------------------------------------+
In the case of a particle based galaxy you can either get the integrated line emission or per-particle line emission (by using a per particle model) with get_lines method.
[2]:
from synthesizer.emission_models import PacmanEmission
from synthesizer.load_data.load_camels import load_CAMELS_IllustrisTNG

# Get the stars from a particle based galaxy
stars = load_CAMELS_IllustrisTNG(
    "../../../tests/data/",
    snap_name="camels_snap.hdf5",
    group_name="camels_subhalo.hdf5",
    physical=True,
)[0].stars

# Set up the emission model
model = PacmanEmission(
    grid=grid,
    tau_v=0.7,
    dust_curve=PowerLaw(slope=-1.3),
    dust_emission=Blackbody(temperature=50 * kelvin),
    fesc=0.5,
    fesc_ly_alpha=1.0,
    per_particle=True,
)

# Get the spectra and lines
stars.get_spectra(model)
stars.get_lines((line_ratios.Hb, line_ratios.O3r, line_ratios.O3b), model)
print(stars.lines["emergent"])
print(stars.particle_lines["emergent"])
+-------------------------------------------------------------------+
|                          LINECOLLECTION                           |
+------------------+------------------------------------------------+
| Attribute        | Value                                          |
+------------------+------------------------------------------------+
| nlines           | 3                                              |
+------------------+------------------------------------------------+
| available_ratios | [R3, ]                                         |
+------------------+------------------------------------------------+
| line_ids         | ['H 1 4861.32A' 'O 3 4958.91A' 'O 3 5006.84A'] |
+------------------+------------------------------------------------+
| wavelengths      | [4861.32 4958.91 5006.84] Å                    |
+------------------+------------------------------------------------+
| lines            | H 1 4861.32A: Line                             |
|                  | O 3 5006.84A: Line                             |
|                  | O 3 4958.91A: Line                             |
+------------------+------------------------------------------------+
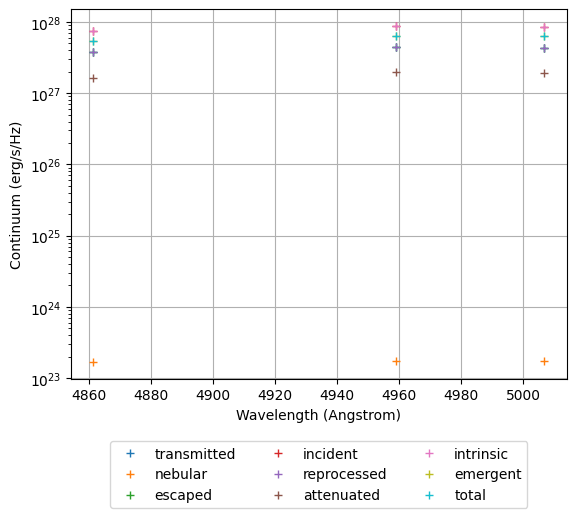
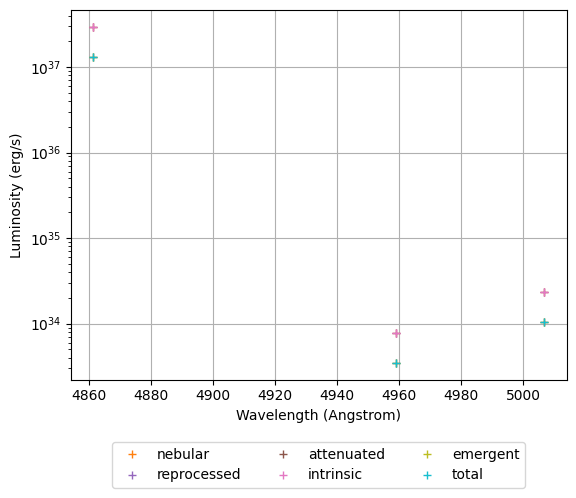
The line luminosities themselves are extracted and stored in the "nebular" key of the lines dictionaries. Below we plot the line luminosities and continuum luminosities to compare the different emissions.
Note that we have skipped any lines with little or no contribution.
[3]:
import matplotlib.pyplot as plt

fig = plt.figure()
ax = fig.add_subplot(111)
ax.grid(True)
ax.set_axisbelow(True)

# Get the colours
colors = {}
for ind, key in enumerate(stars.lines):
    colors[key] = plt.cm.tab10(ind)

for key in stars.lines:
    # Don't plot dust emission since it's effectively 0
    # for these lines
    if key == "dust_emission":
        continue
    for line_id in stars.lines[key].line_ids:
        ax.semilogy(
            stars.lines[key][line_id].wavelength,
            stars.lines[key][line_id].continuum,
            color=colors[key],
            marker="+",
            linestyle="None",
        )

ax.set_xlabel("Wavelength (Angstrom)")
ax.set_ylabel("Continuum (erg/s/Hz)")

# Create the legend
legend_handles = []
for key in stars.lines:
    # Don't plot dust emission since it's effectively 0
    # for these lines
    if key == "dust_emission":
        continue
    legend_handles.append(
        plt.Line2D(
            [0],
            [0],
            color=colors[key],
            label=key,
            marker="+",
            linestyle="None",
        )
    )

ax.legend(
    handles=legend_handles,
    loc="upper center",
    bbox_to_anchor=(0.5, -0.15),
    ncol=3,
)

plt.show()

fig = plt.figure()
ax = fig.add_subplot(111)
ax.grid(True)
ax.set_axisbelow(True)

# Get the colours
colors = {}
for ind, key in enumerate(stars.lines):
    colors[key] = plt.cm.tab10(ind)

for key in stars.lines:
    for line_id in stars.lines[key].line_ids:
        ax.semilogy(
            stars.lines[key][line_id].wavelength,
            stars.lines[key][line_id].luminosity,
            color=colors[key],
            marker="+",
            linestyle="None",
        )

ax.set_xlabel("Wavelength (Angstrom)")
ax.set_ylabel("Luminosity (erg/s)")

# Create the legend
legend_handles = []
for key in stars.lines:
    # Skip all spectra types where lines are 0
    skip = False
    for line_id in stars.lines[key].line_ids:
        if stars.lines[key][line_id].luminosity.sum() == 0:
            skip = True
            break
    if skip:
        continue
    legend_handles.append(
        plt.Line2D(
            [0],
            [0],
            color=colors[key],
            label=key,
            marker="+",
            linestyle="None",
        )
    )

ax.legend(
    handles=legend_handles,
    loc="upper center",
    bbox_to_anchor=(0.5, -0.15),
    ncol=3,
)

plt.show()
Observer frame lines
Just like an Sed lines can be shifted into the observer frame by calling the get_flux method with a cosmology and redshift. This can either be done on a whole LineCollection or an individual Line.
[4]:
from astropy.cosmology import Planck18 as cosmo

# Use a LineCollection level method
stars.lines["emergent"].get_flux(cosmo, z=8)
for line in stars.lines["emergent"]:
    print(f"{line.id}: {line.flux} @ {line.obslam}")

# Extract a line an caluclate its flux (not the flux is both stored
# and returned)
print(stars.lines["nebular"]["H 1 4861.32A"].get_flux(cosmo, z=5))
H 1 4861.32A: 1.6085862555054288e-23 erg/(cm**2*s) @ 43751.88 Å
O 3 4958.91A: 4.318844329903348e-27 erg/(cm**2*s) @ 44630.19 Å
O 3 5006.84A: 1.3015638290665693e-26 erg/(cm**2*s) @ 45061.56 Å
1.0872811355166476e-22 erg/(cm**2*s)
Additionally, just like an Sed object, you can also calculate the rest frame flux at 10 parsecs using the get_flux0 method (again both on a Line and a LineCollection).
[5]:
# Use a LineCollection level method
stars.lines["emergent"].get_flux0()
for line in stars.lines["emergent"]:
    print(f"{line.id}: {line.flux} @ {line.obslam}")
H 1 4861.32A: 0.001086554463674622 erg/(cm**2*s) @ 4861.32 Å
O 3 4958.91A: 2.917257043886558e-07 erg/(cm**2*s) @ 4958.91 Å
O 3 5006.84A: 8.791695088712268e-07 erg/(cm**2*s) @ 5006.84 Å
Blending lines
Lines in a LineCollection can be blended based on a given wavelength resolution using the get_blended_lines method. This method takes a set of wavelength bins, either arbitrarily defined or based on a particular observatory, and returns a new LineCollection containing lines bleneded within each bin.
[6]:
import numpy as np
from unyt import angstrom

print("Before blending:")
print(stars.lines["emergent"])

# Blend the lines  onto an arbitrary wavelength grid
lam_bins = np.arange(4000, 7000, 1000) * angstrom
blended_lines = stars.lines["emergent"].get_blended_lines(lam_bins)

print("After blending:")
print(blended_lines)
Before blending:
+-------------------------------------------------------------------+
|                          LINECOLLECTION                           |
+------------------+------------------------------------------------+
| Attribute        | Value                                          |
+------------------+------------------------------------------------+
| nlines           | 3                                              |
+------------------+------------------------------------------------+
| available_ratios | [R3, ]                                         |
+------------------+------------------------------------------------+
| line_ids         | ['H 1 4861.32A' 'O 3 4958.91A' 'O 3 5006.84A'] |
+------------------+------------------------------------------------+
| wavelengths      | [4861.32 4958.91 5006.84] Å                    |
+------------------+------------------------------------------------+
| lines            | H 1 4861.32A: Line                             |
|                  | O 3 5006.84A: Line                             |
|                  | O 3 4958.91A: Line                             |
+------------------+------------------------------------------------+
After blending:
+------------------------------------------------------------------+
|                          LINECOLLECTION                          |
+------------------+-----------------------------------------------+
| Attribute        | Value                                         |
+------------------+-----------------------------------------------+
| nlines           | 2                                             |
+------------------+-----------------------------------------------+
| available_ratios | [R3, ]                                        |
+------------------+-----------------------------------------------+
| line_ids         | ['H 1 4861.32A, O 3 4958.91A' 'O 3 5006.84A'] |
+------------------+-----------------------------------------------+
| wavelengths      | [4910.115 5006.84 ] Å                         |
+------------------+-----------------------------------------------+
| lines            | H 1 4861.32A, O 3 4958.91A: Line              |
|                  | O 3 5006.84A: Line                            |
+------------------+-----------------------------------------------+