Note
Go to the end to download the full example code.
Plot line of sight diagnostics
This example shows how to compute line of sight dust surface densities, and plots some diagnostics.
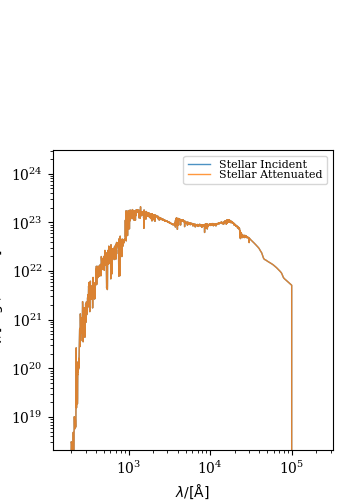
(<Figure size 350x500 with 1 Axes>, <Axes: xlabel='$\\lambda/[\\mathrm{\\AA}]$', ylabel='$L_{\\nu}/[\\mathrm{\\rm{erg} \\ / \\ \\rm{Hz \\cdot \\rm{s}}}]$'>)
import time

import matplotlib.pyplot as plt
import numpy as np
from scipy.spatial import cKDTree
from unyt import Mpc, Msun, Myr

from synthesizer.emission_models import TotalEmission
from synthesizer.emission_models.attenuation import PowerLaw
from synthesizer.grid import Grid
from synthesizer.kernel_functions import Kernel
from synthesizer.parametric import SFH, ZDist
from synthesizer.parametric import Stars as ParametricStars
from synthesizer.particle.galaxy import Galaxy
from synthesizer.particle.gas import Gas
from synthesizer.particle.particles import CoordinateGenerator
from synthesizer.particle.stars import sample_sfzh

plt.rcParams["font.family"] = "DeJavu Serif"
plt.rcParams["font.serif"] = ["Times New Roman"]


def calculate_smoothing_lengths(positions, num_neighbors=56):
    """Calculate the SPH smoothing lengths for a set of coordinates."""
    tree = cKDTree(positions)
    distances, _ = tree.query(positions, k=num_neighbors + 1)

    # The k-th nearest neighbor distance (k = num_neighbors)
    kth_distances = distances[:, num_neighbors]

    # Set the smoothing length to the k-th nearest neighbor
    # distance divided by 2.0
    smoothing_lengths = kth_distances / 2.0

    return smoothing_lengths


# Set the seed
np.random.seed(42)

start = time.time()

# Get the location of this script, __file__ is the absolute path of this
# script, however we just want to directory
# script_path = os.path.abspath(os.path.dirname(__file__))

# Define the grid
grid_name = "test_grid"
grid_dir = "../../tests/test_grid/"
grid = Grid(grid_name, grid_dir=grid_dir)

# Define the model
model = TotalEmission(
    grid,
    tau_v="tau_v",
    dust_curve=PowerLaw(slope=-1),
    fesc=0.1,
    per_particle=True,
)

# Define the grid (normally this would be defined by an SPS grid)
log10ages = np.arange(6.0, 10.5, 0.1)
metallicities = 10 ** np.arange(-5.0, -1.5, 0.1)
Z_p = {"metallicity": 0.01}
metal_dist = ZDist.DeltaConstant(**Z_p)
sfh_p = {"duration": 100 * Myr}
sfh = SFH.Constant(**sfh_p)  # constant star formation

# Generate the star formation metallicity history
mass = 10**10 * Msun
param_stars = ParametricStars(
    log10ages,
    metallicities,
    sf_hist=sfh,
    metal_dist=metal_dist,
    initial_mass=mass,
)

# How many stars and gas particles?
nstars = 1000
ngas = 1000

# Generate some random coordinates
coords = CoordinateGenerator.generate_3D_gaussian(nstars)

# Calculate smoothing lengths
smls = calculate_smoothing_lengths(coords)

# Sample the SFZH, producing a Stars object
# we will also pass some keyword arguments for attributes
# we will need for imaging
stars = sample_sfzh(
    param_stars.sfzh,
    param_stars.log10ages,
    param_stars.log10metallicities,
    nstars,
    coordinates=coords * Mpc,
    current_masses=np.full(nstars, 10**8.7 / nstars) * Msun,
    smoothing_lengths=smls * Mpc,
    redshift=1,
)

# Now make the gas

# Generate some random coordinates
coords = CoordinateGenerator.generate_3D_gaussian(ngas)

# Calculate the smoothing lengths
smls = calculate_smoothing_lengths(coords)

gas = Gas(
    masses=np.random.uniform(10**6, 10**6.5, ngas) * Msun,
    metallicities=np.random.uniform(0.01, 0.05, ngas),
    coordinates=coords * Mpc,
    smoothing_lengths=smls * Mpc,
    dust_to_metal_ratio=0.2,
)

# Create galaxy object
galaxy = Galaxy("Galaxy", stars=stars, gas=gas, redshift=1)


# Get the SPH kernel
sph_kernel = Kernel()
kernel_data = sph_kernel.get_kernel()

# Calculate the tau_vs
galaxy.get_stellar_los_tau_v(
    kappa=0.07,
    kernel=kernel_data,
    force_loop=False,
)

# Get the spectra (this will automatically use the tau_vs we just calculated
# since the emission model has tau_v="tau_v")
galaxy.stars.get_spectra(model)

# Integrate the particle spectra
galaxy.integrate_particle_spectra()

# Plot the Sed
galaxy.plot_spectra(show=True, combined_spectra=False, stellar_spectra=True)
Total running time of the script: (0 minutes 2.400 seconds)