Note
Go to the end to download the full example code.
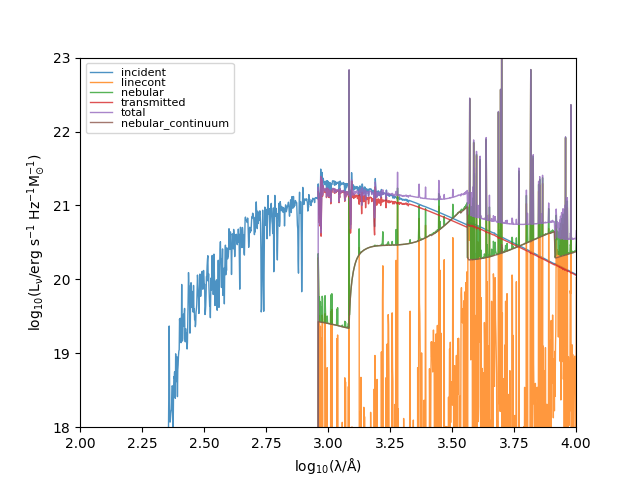
Plot spectra example
This example demonstrates how to extract a spectra directly from a grid and plots all the available spectra.
NOTE: this only works on 2D grids at the moment
+-------------------------------------------------------------------------------------------------+
|                                               SED                                               |
+---------------------------+---------------------------------------------------------------------+
| Attribute                 | Value                                                               |
+---------------------------+---------------------------------------------------------------------+
| redshift                  | 0                                                                   |
+---------------------------+---------------------------------------------------------------------+
| ndim                      | 1                                                                   |
+---------------------------+---------------------------------------------------------------------+
| shape                     | (9244,)                                                             |
+---------------------------+---------------------------------------------------------------------+
| lam (9244,)               | 1.30e-04 Å -> 2.99e+11 Å (Mean: 9.73e+09 Å)                         |
+---------------------------+---------------------------------------------------------------------+
| nu (9244,)                | 1.00e+07 Hz -> 2.31e+22 Hz (Mean: 8.51e+19 Hz)                      |
+---------------------------+---------------------------------------------------------------------+
| lnu (9244,)               | 0.00e+00 erg/(Hz*s) -> 3.10e+21 erg/(Hz*s) (Mean: 9.16e+19 erg)     |
+---------------------------+---------------------------------------------------------------------+
| bolometric_luminosity     | 7.016148283811727e+36 erg/s                                         |
+---------------------------+---------------------------------------------------------------------+
| bolometric_luminosity     | 7.016148283811727e+36 erg/s                                         |
+---------------------------+---------------------------------------------------------------------+
| llam (9244,)              | 0.00e+00 erg/(s*Å) -> 1.27e+34 erg/(s*Å) (Mean: 2.79e+32 erg/(s*Å)) |
+---------------------------+---------------------------------------------------------------------+
| luminosity (9244,)        | 0.00e+00 erg/s -> 9.95e+36 erg/s (Mean: 2.28e+35 erg/s)             |
+---------------------------+---------------------------------------------------------------------+
| luminosity_lambda (9244,) | 0.00e+00 erg/(s*Å) -> 1.27e+34 erg/(s*Å) (Mean: 2.79e+32 erg/(s*Å)) |
+---------------------------+---------------------------------------------------------------------+
| luminosity_nu (9244,)     | 0.00e+00 erg/(Hz*s) -> 3.10e+21 erg/(Hz*s) (Mean: 9.16e+19 erg)     |
+---------------------------+---------------------------------------------------------------------+
| wavelength (9244,)        | 1.30e-04 Å -> 2.99e+11 Å (Mean: 9.73e+09 Å)                         |
+---------------------------+---------------------------------------------------------------------+
+-------------------------------------------------------------------------------------------------+
|                                               SED                                               |
+---------------------------+---------------------------------------------------------------------+
| Attribute                 | Value                                                               |
+---------------------------+---------------------------------------------------------------------+
| redshift                  | 0                                                                   |
+---------------------------+---------------------------------------------------------------------+
| ndim                      | 1                                                                   |
+---------------------------+---------------------------------------------------------------------+
| shape                     | (9244,)                                                             |
+---------------------------+---------------------------------------------------------------------+
| lam (9244,)               | 1.30e-04 Å -> 2.99e+11 Å (Mean: 9.73e+09 Å)                         |
+---------------------------+---------------------------------------------------------------------+
| nu (9244,)                | 1.00e+07 Hz -> 2.31e+22 Hz (Mean: 8.51e+19 Hz)                      |
+---------------------------+---------------------------------------------------------------------+
| lnu (9244,)               | 0.00e+00 erg/(Hz*s) -> 2.58e+24 erg/(Hz*s) (Mean: 6.81e+20 erg)     |
+---------------------------+---------------------------------------------------------------------+
| bolometric_luminosity     | 1.4662198737684575e+36 erg/s                                        |
+---------------------------+---------------------------------------------------------------------+
| bolometric_luminosity     | 1.4662198737684575e+36 erg/s                                        |
+---------------------------+---------------------------------------------------------------------+
| llam (9244,)              | 0.00e+00 erg/(s*Å) -> 1.36e+35 erg/(s*Å) (Mean: 1.99e+31 erg/(s*Å)) |
+---------------------------+---------------------------------------------------------------------+
| luminosity (9244,)        | 0.00e+00 erg/s -> 1.66e+38 erg/s (Mean: 4.76e+34 erg/s)             |
+---------------------------+---------------------------------------------------------------------+
| luminosity_lambda (9244,) | 0.00e+00 erg/(s*Å) -> 1.36e+35 erg/(s*Å) (Mean: 1.99e+31 erg/(s*Å)) |
+---------------------------+---------------------------------------------------------------------+
| luminosity_nu (9244,)     | 0.00e+00 erg/(Hz*s) -> 2.58e+24 erg/(Hz*s) (Mean: 6.81e+20 erg)     |
+---------------------------+---------------------------------------------------------------------+
| wavelength (9244,)        | 1.30e-04 Å -> 2.99e+11 Å (Mean: 9.73e+09 Å)                         |
+---------------------------+---------------------------------------------------------------------+
+-------------------------------------------------------------------------------------------------+
|                                               SED                                               |
+---------------------------+---------------------------------------------------------------------+
| Attribute                 | Value                                                               |
+---------------------------+---------------------------------------------------------------------+
| redshift                  | 0                                                                   |
+---------------------------+---------------------------------------------------------------------+
| ndim                      | 1                                                                   |
+---------------------------+---------------------------------------------------------------------+
| shape                     | (9244,)                                                             |
+---------------------------+---------------------------------------------------------------------+
| lam (9244,)               | 1.30e-04 Å -> 2.99e+11 Å (Mean: 9.73e+09 Å)                         |
+---------------------------+---------------------------------------------------------------------+
| nu (9244,)                | 1.00e+07 Hz -> 2.31e+22 Hz (Mean: 8.51e+19 Hz)                      |
+---------------------------+---------------------------------------------------------------------+
| lnu (9244,)               | 0.00e+00 erg/(Hz*s) -> 2.74e+24 erg/(Hz*s) (Mean: 8.27e+21 erg)     |
+---------------------------+---------------------------------------------------------------------+
| bolometric_luminosity     | 3.958428213850621e+36 erg/s                                         |
+---------------------------+---------------------------------------------------------------------+
| bolometric_luminosity     | 3.958428213850621e+36 erg/s                                         |
+---------------------------+---------------------------------------------------------------------+
| llam (9244,)              | 0.00e+00 erg/(s*Å) -> 1.36e+35 erg/(s*Å) (Mean: 3.02e+31 erg/(s*Å)) |
+---------------------------+---------------------------------------------------------------------+
| luminosity (9244,)        | 0.00e+00 erg/s -> 1.66e+38 erg/s (Mean: 1.28e+35 erg/s)             |
+---------------------------+---------------------------------------------------------------------+
| luminosity_lambda (9244,) | 0.00e+00 erg/(s*Å) -> 1.36e+35 erg/(s*Å) (Mean: 3.02e+31 erg/(s*Å)) |
+---------------------------+---------------------------------------------------------------------+
| luminosity_nu (9244,)     | 0.00e+00 erg/(Hz*s) -> 2.74e+24 erg/(Hz*s) (Mean: 8.27e+21 erg)     |
+---------------------------+---------------------------------------------------------------------+
| wavelength (9244,)        | 1.30e-04 Å -> 2.99e+11 Å (Mean: 9.73e+09 Å)                         |
+---------------------------+---------------------------------------------------------------------+
+-------------------------------------------------------------------------------------------------+
|                                               SED                                               |
+---------------------------+---------------------------------------------------------------------+
| Attribute                 | Value                                                               |
+---------------------------+---------------------------------------------------------------------+
| redshift                  | 0                                                                   |
+---------------------------+---------------------------------------------------------------------+
| ndim                      | 1                                                                   |
+---------------------------+---------------------------------------------------------------------+
| shape                     | (9244,)                                                             |
+---------------------------+---------------------------------------------------------------------+
| lam (9244,)               | 1.30e-04 Å -> 2.99e+11 Å (Mean: 9.73e+09 Å)                         |
+---------------------------+---------------------------------------------------------------------+
| nu (9244,)                | 1.00e+07 Hz -> 2.31e+22 Hz (Mean: 8.51e+19 Hz)                      |
+---------------------------+---------------------------------------------------------------------+
| lnu (9244,)               | 0.00e+00 erg/(Hz*s) -> 2.45e+21 erg/(Hz*s) (Mean: 5.94e+19 erg)     |
+---------------------------+---------------------------------------------------------------------+
| bolometric_luminosity     | 3.0749897473336537e+36 erg/s                                        |
+---------------------------+---------------------------------------------------------------------+
| bolometric_luminosity     | 3.0749897473336537e+36 erg/s                                        |
+---------------------------+---------------------------------------------------------------------+
| llam (9244,)              | 0.00e+00 erg/(s*Å) -> 8.39e+33 erg/(s*Å) (Mean: 7.04e+31 erg/(s*Å)) |
+---------------------------+---------------------------------------------------------------------+
| luminosity (9244,)        | 0.00e+00 erg/s -> 7.84e+36 erg/s (Mean: 9.99e+34 erg/s)             |
+---------------------------+---------------------------------------------------------------------+
| luminosity_lambda (9244,) | 0.00e+00 erg/(s*Å) -> 8.39e+33 erg/(s*Å) (Mean: 7.04e+31 erg/(s*Å)) |
+---------------------------+---------------------------------------------------------------------+
| luminosity_nu (9244,)     | 0.00e+00 erg/(Hz*s) -> 2.45e+21 erg/(Hz*s) (Mean: 5.94e+19 erg)     |
+---------------------------+---------------------------------------------------------------------+
| wavelength (9244,)        | 1.30e-04 Å -> 2.99e+11 Å (Mean: 9.73e+09 Å)                         |
+---------------------------+---------------------------------------------------------------------+
+-------------------------------------------------------------------------------------------------+
|                                               SED                                               |
+---------------------------+---------------------------------------------------------------------+
| Attribute                 | Value                                                               |
+---------------------------+---------------------------------------------------------------------+
| redshift                  | 0                                                                   |
+---------------------------+---------------------------------------------------------------------+
| ndim                      | 1                                                                   |
+---------------------------+---------------------------------------------------------------------+
| shape                     | (9244,)                                                             |
+---------------------------+---------------------------------------------------------------------+
| lam (9244,)               | 1.30e-04 Å -> 2.99e+11 Å (Mean: 9.73e+09 Å)                         |
+---------------------------+---------------------------------------------------------------------+
| nu (9244,)                | 1.00e+07 Hz -> 2.31e+22 Hz (Mean: 8.51e+19 Hz)                      |
+---------------------------+---------------------------------------------------------------------+
| lnu (9244,)               | 0.00e+00 erg/(Hz*s) -> 2.74e+24 erg/(Hz*s) (Mean: 8.32e+21 erg)     |
+---------------------------+---------------------------------------------------------------------+
| bolometric_luminosity     | 7.033417961184266e+36 erg/s                                         |
+---------------------------+---------------------------------------------------------------------+
| bolometric_luminosity     | 7.033417961184266e+36 erg/s                                         |
+---------------------------+---------------------------------------------------------------------+
| llam (9244,)              | 0.00e+00 erg/(s*Å) -> 1.39e+35 erg/(s*Å) (Mean: 1.01e+32 erg/(s*Å)) |
+---------------------------+---------------------------------------------------------------------+
| luminosity (9244,)        | 0.00e+00 erg/s -> 1.69e+38 erg/s (Mean: 2.28e+35 erg/s)             |
+---------------------------+---------------------------------------------------------------------+
| luminosity_lambda (9244,) | 0.00e+00 erg/(s*Å) -> 1.39e+35 erg/(s*Å) (Mean: 1.01e+32 erg/(s*Å)) |
+---------------------------+---------------------------------------------------------------------+
| luminosity_nu (9244,)     | 0.00e+00 erg/(Hz*s) -> 2.74e+24 erg/(Hz*s) (Mean: 8.32e+21 erg)     |
+---------------------------+---------------------------------------------------------------------+
| wavelength (9244,)        | 1.30e-04 Å -> 2.99e+11 Å (Mean: 9.73e+09 Å)                         |
+---------------------------+---------------------------------------------------------------------+
+-------------------------------------------------------------------------------------------------+
|                                               SED                                               |
+---------------------------+---------------------------------------------------------------------+
| Attribute                 | Value                                                               |
+---------------------------+---------------------------------------------------------------------+
| redshift                  | 0                                                                   |
+---------------------------+---------------------------------------------------------------------+
| ndim                      | 1                                                                   |
+---------------------------+---------------------------------------------------------------------+
| shape                     | (9244,)                                                             |
+---------------------------+---------------------------------------------------------------------+
| lam (9244,)               | 1.30e-04 Å -> 2.99e+11 Å (Mean: 9.73e+09 Å)                         |
+---------------------------+---------------------------------------------------------------------+
| nu (9244,)                | 1.00e+07 Hz -> 2.31e+22 Hz (Mean: 8.51e+19 Hz)                      |
+---------------------------+---------------------------------------------------------------------+
| lnu (9244,)               | 0.00e+00 erg/(Hz*s) -> 1.82e+23 erg/(Hz*s) (Mean: 7.58e+21 erg)     |
+---------------------------+---------------------------------------------------------------------+
| bolometric_luminosity     | 2.4922083400821472e+36 erg/s                                        |
+---------------------------+---------------------------------------------------------------------+
| bolometric_luminosity     | 2.4922083400821472e+36 erg/s                                        |
+---------------------------+---------------------------------------------------------------------+
| llam (9244,)              | 0.00e+00 erg/(s*Å) -> 3.83e+32 erg/(s*Å) (Mean: 1.03e+31 erg/(s*Å)) |
+---------------------------+---------------------------------------------------------------------+
| luminosity (9244,)        | 0.00e+00 erg/s -> 1.48e+36 erg/s (Mean: 8.09e+34 erg/s)             |
+---------------------------+---------------------------------------------------------------------+
| luminosity_lambda (9244,) | 0.00e+00 erg/(s*Å) -> 3.83e+32 erg/(s*Å) (Mean: 1.03e+31 erg/(s*Å)) |
+---------------------------+---------------------------------------------------------------------+
| luminosity_nu (9244,)     | 0.00e+00 erg/(Hz*s) -> 1.82e+23 erg/(Hz*s) (Mean: 7.58e+21 erg)     |
+---------------------------+---------------------------------------------------------------------+
| wavelength (9244,)        | 1.30e-04 Å -> 2.99e+11 Å (Mean: 9.73e+09 Å)                         |
+---------------------------+---------------------------------------------------------------------+
import argparse

import matplotlib.pyplot as plt
import numpy as np

from synthesizer.grid import Grid

if __name__ == "__main__":
    # Get the location of this script, __file__ is the absolute path of this
    # script, however we just want to directory
    # script_path = os.path.abspath(os.path.dirname(__file__))

    # define the test grid dir
    # test_grid_dir = script_path + "/../../tests/test_grid/"
    test_grid_dir = "../../tests/test_grid/"

    # initialise argument parser
    parser = argparse.ArgumentParser(
        description=(
            "Create a plot of all spectra types for a given metallicity and \
            age"
        )
    )

    # The name of the grid. Defaults to the test grid.
    parser.add_argument(
        "-grid_name",
        "--grid_name",
        type=str,
        required=False,
        default="test_grid",
    )

    # The path to the grid directory. Defaults to the test grid directory.
    parser.add_argument(
        "-grid_dir",
        "--grid_dir",
        type=str,
        required=False,
        default=test_grid_dir,
    )

    # The target metallicity. The code function will find the closest
    # metallicity and report it back. The rationale behind this is
    # that this code can easily be adapted to explore other grids.
    parser.add_argument(
        "-metallicity", type=float, required=False, default=0.01
    )

    # The target log10(age/yr). The code function will find the closest
    # metallicity and report it back. The rationale behind this is that
    # this code can easily be adapted to explore other grids.
    parser.add_argument("-log10age", type=float, required=False, default=6.0)

    # Get dictionary of arguments
    args = parser.parse_args()

    # initialise grid
    grid = Grid(args.grid_name, grid_dir=args.grid_dir)

    # get the grid point for this log10age and metallicity
    grid_point = grid.get_grid_point(
        log10ages=args.log10age,
        metallicity=args.metallicity,
    )

    # loop over available spectra and plot
    for spec_name in grid.available_spectra:
        # get Sed object
        sed = grid.get_spectra(grid_point, spectra_id=spec_name)
        # print summary of SED object
        print(sed)
        plt.plot(
            np.log10(sed.lam),
            np.log10(sed.lnu),
            lw=1,
            alpha=0.8,
            label=spec_name,
        )

    plt.xlim([2.0, 4.0])
    plt.ylim([18.0, 23])
    plt.legend(fontsize=8, labelspacing=0.0)
    plt.xlabel(r"$\rm log_{10}(\lambda/\AA)$")
    plt.ylabel(r"$\rm log_{10}(L_{\nu}/erg\ s^{-1}\ Hz^{-1} M_{\odot}^{-1})$")
    plt.show()
Total running time of the script: (0 minutes 0.455 seconds)