Note
Go to the end to download the full example code.
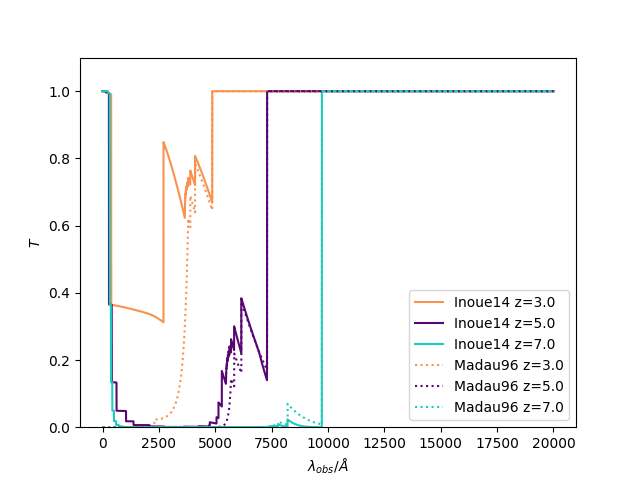
IGM transmission example
Plot IGM transmission curves (Inoue+14 & Madau+96
import cmasher as cmr
import matplotlib.pyplot as plt
import numpy as np

from synthesizer.emission_models.attenuation.igm import Inoue14, Madau96

lam = np.arange(0, 20000)


redshifts = [3.0, 5.0, 7.0]
colors = cmr.take_cmap_colors("cmr.guppy", len(redshifts))

for IGM, ls in zip([Inoue14, Madau96], ["-", ":"]):
    igm = IGM()
    for z, color in zip(redshifts, colors):
        plt.plot(
            lam,
            igm.get_transmission(z, lam),
            ls=ls,
            c=color,
            label=f"{igm.name} z={z}",
        )

plt.legend()
plt.xlabel(r"$\lambda_{obs}/\AA$")
plt.ylabel(r"$T$")
plt.ylim([0, 1.1])
plt.show()
# plt.savefig('../docs/source/images/img.png', bbox_inches='tight', dpi=200)
Total running time of the script: (0 minutes 0.806 seconds)