Generating Rest Frame SEDs from a Parametric Galaxy
Building on the make_sfzh documents we can now see how to generate a galaxy and produce its rest-frame spectral energy distribution.
[1]:
import matplotlib.pyplot as plt
from synthesizer.filters import FilterCollection
from synthesizer.grid import Grid
from synthesizer.parametric import SFH, Stars, ZDist
from synthesizer.parametric.galaxy import Galaxy
from synthesizer.sed import plot_spectra_as_rainbow
from unyt import Angstrom, Msun, Myr
We begin by initialising a Grid:
[2]:
grid_name = "test_grid"
grid_dir = "../../../tests/test_grid/"
grid = Grid(grid_name, grid_dir=grid_dir)
Next we can define the star formation and metal enrichment history:
[3]:
# Define the functional form of the star formation and
# metal enrichment histories

# Constant star formation
sfh = SFH.Constant(duration=100 * Myr)

# Constant metallicity
metal_dist = ZDist.DeltaConstant(log10metallicity=-2.0)

print(sfh)  # print sfh summary

# Get the 2D star formation and metal enrichment history for
# the given SPS grid. This is (age, Z).
stars = Stars(
    grid.log10age,
    grid.metallicity,
    sf_hist=sfh,
    metal_dist=metal_dist,
    initial_mass=10**8,
)
print(stars)
----------
SUMMARY OF PARAMETERISED STAR FORMATION HISTORY
<class 'synthesizer.parametric.sf_hist.Constant'>
duration: 100 Myr
median age: 50.00 Myr
mean age: 50.00 Myr
----------

----------
SUMMARY OF BINNED SFZH
median age: 50.12 Myr
mean age: 50.01 Myr
mean metallicity: 0.0100
----------
Create a Galaxy object using this SZFH:
[4]:
galaxy = Galaxy(stars)
When combined with a Grid we can now generate the spectral energy distribution of a galaxy. There are a range of options available to us here, most depending on whether we include nebular emission and/or dust.
Let’s star with just the pure stellar spectra. As you can see there is also a method on Galaxy objects that allows us to quickly plot spectra.
[5]:
galaxy.stars.get_spectra_incident(grid)
galaxy.stars.plot_spectra()
[5]:
(<Figure size 350x500 with 1 Axes>,
 <Axes: xlabel='$\\lambda/[\\mathrm{\\AA}]$', ylabel='$L_{\\nu}/[\\mathrm{\\rm{erg} \\ / \\ \\rm{Hz \\cdot \\rm{s}}}]$'>)
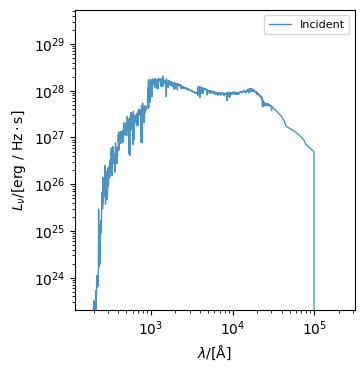
However, in most cases we might like to access spectra directly. Spectra are stored within each Galaxy in the spectra dictionary.
[6]:
sed = galaxy.stars.spectra["incident"]
Spectra are stored in Sed objects. There is a separate tutorial on these but the contain the spectra, wavelength grid, and have access to a range of other methods, e.g. for caclulating broadband photometry.
[7]:
print(sed)
----------
SUMMARY OF SED
Number of wavelength points: 9244
Wavelength range: [0.00 Å,             299293000000.00 Å]
log10(Peak luminosity/erg/(Hz*s)):             28.31
log10(Bolometric luminosity/erg/s):43.70291892001869----------
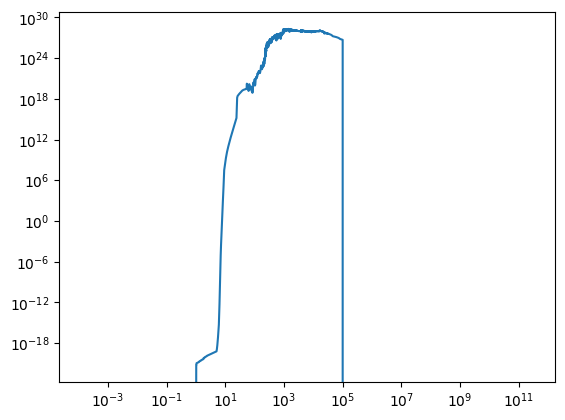
[8]:
plt.loglog(sed.lam, sed.lnu)
plt.show()
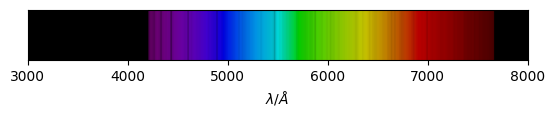
[9]:
fig, ax = plot_spectra_as_rainbow(sed)
plt.show()
Next, we can generate spectra including nebular emission. In the parlance of synthesizer these are reprocessed spectra. This introduces a new free parameter, the Lyman-continuum escape fraction, fesc.
[10]:
galaxy.stars.get_spectra_reprocessed(grid, fesc=0.5)
galaxy.stars.plot_spectra()
[10]:
(<Figure size 350x500 with 1 Axes>,
 <Axes: xlabel='$\\lambda/[\\mathrm{\\AA}]$', ylabel='$L_{\\nu}/[\\mathrm{\\rm{erg} \\ / \\ \\rm{Hz \\cdot \\rm{s}}}]$'>)
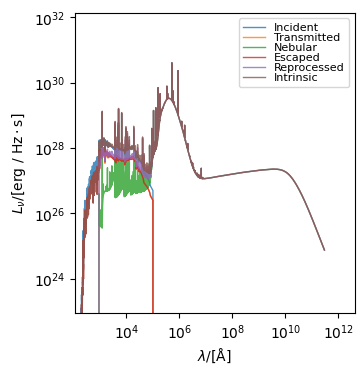
get_spectra_reprocessed() actually generates more than just the reprocessed spectra, if also generates the incident, transmitted, nebular, and intrinsic spectra. If fesc>0 it also generates escaped. The definitions of all of these are described in the spectra docs.
At anytime we can get a list of the spectra associated with a galaxy using:
[11]:
print(galaxy.stars.spectra.keys())
dict_keys(['incident', 'transmitted', 'nebular', 'escaped', 'reprocessed', 'intrinsic'])
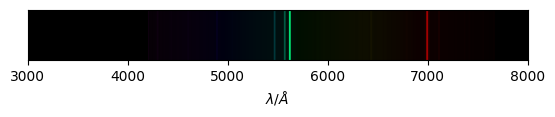
[12]:
fig, ax = plot_spectra_as_rainbow(galaxy.stars.spectra["intrinsic"])
plt.show()
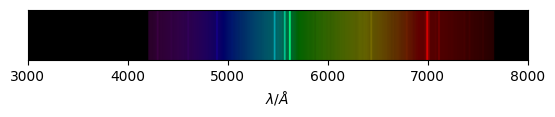
fig, ax = plot_spectra_as_rainbow(
galaxy.stars.spectra["intrinsic"], logged=True
)
plt.show()
get_spectra_reprocessed() also includes a parameter allowing us to suppress Lyman-alpha emission, the Lyman-alpha escape fraction fesc_LyA.
[13]:
galaxy.spectra = {}  # reset spectra
galaxy.stars.get_spectra_reprocessed(grid, fesc=0.5, fesc_LyA=0.0)
galaxy.stars.plot_spectra()
[13]:
(<Figure size 350x500 with 1 Axes>,
 <Axes: xlabel='$\\lambda/[\\mathrm{\\AA}]$', ylabel='$L_{\\nu}/[\\mathrm{\\rm{erg} \\ / \\ \\rm{Hz \\cdot \\rm{s}}}]$'>)

Dust attenuation in synthesizer is implemented via the flexible Pacman model. This model has a few features:
In this model the parameter
fescdenotes the fraction of light that entirely escapes a galaxy with no reprocessing by gas or dust.Like the
get_spectra_reprocessed()you can also set the Lyman-alpha escape fractionfesc_LyAhere.It is possible to calculate spectra for both a young and old component each with different dust attenuation.
Various different dust attenuation (and emission) are provided. By default we use a simple power-law.
For dust attenuation the required free parameter here is
tau_vthe attenuation at 5500A. If an array is provided.
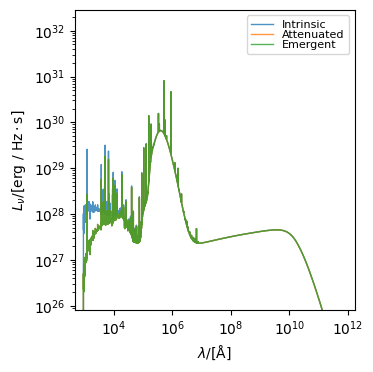
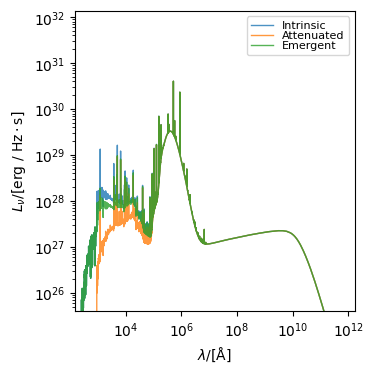
First, let’s add dust attenuation using a simple screen model with a V-band optical depth tau_v=0.5 and a power-law attenuation curve with alpha=-1.
[14]:
galaxy.spectra = {}  # reset spectra
galaxy.stars.get_spectra_pacman(grid, tau_v=0.5, alpha=-1)
galaxy.stars.plot_spectra(
    spectra_to_plot=["intrinsic", "attenuated", "emergent"]
)
[14]:
(<Figure size 350x500 with 1 Axes>,
 <Axes: xlabel='$\\lambda/[\\mathrm{\\AA}]$', ylabel='$L_{\\nu}/[\\mathrm{\\rm{erg} \\ / \\ \\rm{Hz \\cdot \\rm{s}}}]$'>)
Next, let’s allow fesc to vary. In the pacman model the fraction of light escaping reprocessing by gas also escape dust attenuation.
[15]:
galaxy.spectra = {}  # reset spectra
galaxy.stars.get_spectra_pacman(grid, tau_v=0.5, alpha=-1, fesc=0.5)
galaxy.stars.plot_spectra(
    spectra_to_plot=["intrinsic", "attenuated", "emergent"]
)
[15]:
(<Figure size 350x500 with 1 Axes>,
 <Axes: xlabel='$\\lambda/[\\mathrm{\\AA}]$', ylabel='$L_{\\nu}/[\\mathrm{\\rm{erg} \\ / \\ \\rm{Hz \\cdot \\rm{s}}}]$'>)
Note, that despite the same tau_v the actual attenuation is much less. Fortunately if we want to know the true attenuation there is a method A() on Galaxy for that which take the wavelength.
[16]:
# FIX COMING SOON
# galaxy.A(5500*Angstrom)
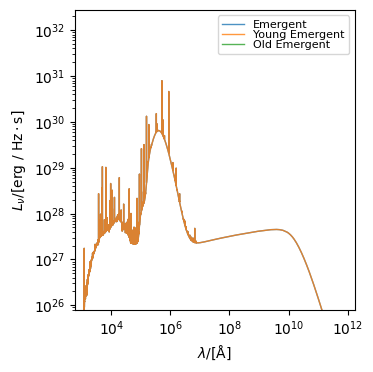
get_spectra_pacman() can also implement dust attenuation separately for both young and old components (where the threshold is set by young_old_thresh which is log10(threshold/yr)). In this case it is also necessary to provide tau_v and alpha as pairs of values describing the ISM and birth-cloud components. Note, young stellar populations feel attenuation from both the ISM and birth-cloud components.
[17]:
galaxy.spectra = {}  # reset spectra
tau_v_ISM = 0.5  # ISM component of dust attenuation
tau_v_BC = 0.5  # birth-cloud componest of dust attenuation
tau_v = [tau_v_ISM, tau_v_BC]
alpha = [-0.7, -1.3]
galaxy.stars.get_spectra_pacman(
    grid, tau_v=tau_v, alpha=alpha, young_old_thresh=10 * Myr
)
galaxy.stars.plot_spectra(
    spectra_to_plot=["emergent", "young_emergent", "old_emergent"]
)
[17]:
(<Figure size 350x500 with 1 Axes>,
 <Axes: xlabel='$\\lambda/[\\mathrm{\\AA}]$', ylabel='$L_{\\nu}/[\\mathrm{\\rm{erg} \\ / \\ \\rm{Hz \\cdot \\rm{s}}}]$'>)
For users more familiar with the Charlot and Fall (2000) two component dust model synthesizer also includes a get_spectra_CharlotFall() method, which is really a wrapper around the more generic get_spectra_pacman() method. The difference is that fesc is implicitly assumed to 0.0 and there is a more familiar way of setting the parameters.
[18]:
galaxy.stars.get_spectra_CharlotFall(
    grid, tau_v_ISM=0.5, tau_v_BC=0.5, alpha_ISM=-0.7, alpha_BC=-1.3
)
galaxy.stars.plot_spectra(
    spectra_to_plot=["emergent", "young_emergent", "old_emergent"],
    quantity_to_plot="luminosity",
)
[18]:
(<Figure size 350x500 with 1 Axes>,
 <Axes: xlabel='$\\lambda/[\\mathrm{\\AA}]$', ylabel='$L/[\\mathrm{\\rm{erg} / \\rm{s}}]$'>)
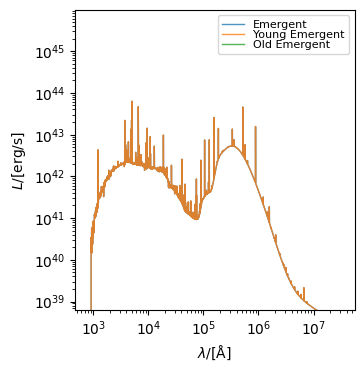
Here we also demonstrate that the luminosity can be plotted instead of the spectral luminosity density by passing quantity_to_plot="luminosity" to the plot_spectra method. In fact, any quantity stored on an Sed can be passed to this argument to plot the respective quantity. These options include “lnu”, “luminosity” or “llam” for rest frame spectra or “fnu”, “flam” or “flux” for observed spectra.
Dust emission
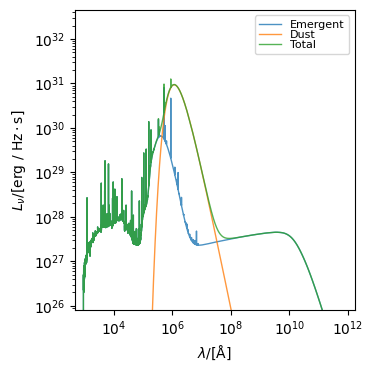
synthesizer can also be used to model emission through a simple energy balance approach. To do this we can supply a method that calculates an attenuated spectrum a synthesizer.dust.emission.DustEmission object. synthesizer has several built-in and these are described in insert referenc.
[19]:
from synthesizer.dust.emission import Greybody, IR_templates
from unyt import K
If we provide a single attenuation (and curve) we need to only provide a single dust_emission model:
[20]:
# initialise a greybody dust emission model
dust_emission_model = Greybody(30 * K, 1.2)

galaxy.spectra = {}  # reset spectra
galaxy.stars.get_spectra_pacman(
    grid, tau_v=0.5, alpha=-1, dust_emission_model=dust_emission_model
)
galaxy.stars.plot_spectra(spectra_to_plot=["emergent", "dust", "total"])

print(
    "Dust luminosity =",
    galaxy.stars.spectra["total"].measure_window_luminosity(
        window=[1e4 * Angstrom, 1e7 * Angstrom]
    ),
)
Using dust temperature based models for dust emission
Dust luminosity = 3.9807729108671155e+43 erg/s
/opt/hostedtoolcache/Python/3.10.14/x64/lib/python3.10/site-packages/unyt/array.py:1824: RuntimeWarning: overflow encountered in exp
  out_arr = func(np.asarray(inp), out=out_func, **kwargs)
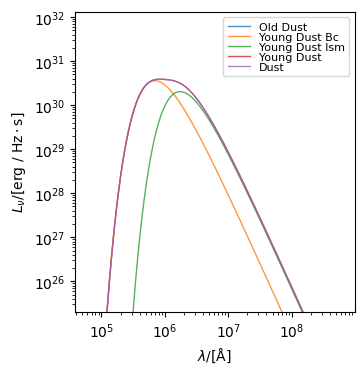
We can also specificy different dust emission models for the birth cloud and ISM (diffuse) dust separately:
[21]:
galaxy.spectra = {} # reset spectra
tau_v_ISM = 0.5 # ISM component of dust attenuation
tau_v_BC = 0.5 # birth-cloud componest of dust attenuation
tau_v = [tau_v_ISM, tau_v_BC]
alpha = [-0.7, -1.3]
dust_emission_ISM = Greybody(20 * K, 1.2)
dust_emission_BC = Greybody(50 * K, 1.2)
dust_emission_model = [dust_emission_ISM, dust_emission_BC]
galaxy.stars.get_spectra_pacman(
grid,
tau_v=tau_v,
alpha=alpha,
young_old_thresh=10 * Myr,
dust_emission_model=dust_emission_model,
)
galaxy.stars.plot_spectra(
spectra_to_plot=[
"old_dust",
"young_dust_BC",
"young_dust_ISM",
"young_dust",
"dust",
]
)
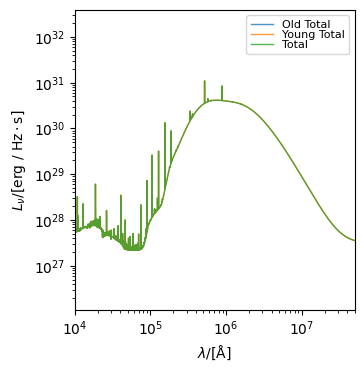
galaxy.stars.plot_spectra(
spectra_to_plot=["old_total", "young_total", "total"]
)
plt.xlim(1e4, 5e7)
print(
"Dust luminosity =",
galaxy.stars.spectra["total"].measure_window_luminosity(
window=[1e4 * Angstrom, 1e7 * Angstrom]
),
)
Dust luminosity = 3.2601512166279973e+43 erg/s
We can instead specify IR template spectra as well
[22]:
galaxy.spectra = {}  # reset spectra
grid_name_ir = "MW3.1"
grid_dir_ir = "../../../tests/test_grid/"
grid_ir = Grid(
    grid_name_ir, grid_dir=grid_dir_ir, read_spectra=True, read_lines=False
)
---------------------------------------------------------------------------
FileNotFoundError                         Traceback (most recent call last)
Cell In[22], line 4
      2 grid_name_ir = "MW3.1"
      3 grid_dir_ir = "../../../tests/test_grid/"
----> 4 grid_ir = Grid(
      5     grid_name_ir, grid_dir=grid_dir_ir, read_spectra=True, read_lines=False
      6 )

File ~/work/synthesizer/synthesizer/src/synthesizer/grid.py:171, in Grid.__init__(self, grid_name, grid_dir, read_spectra, read_lines, new_lam, filters, lam_lims)
    168 self.parameters = {}
    170 # Get the axes of the grid from the HDF5 file
--> 171 self._get_axes()
    173 # Get the ionising luminosity (if available)
    174 self._get_ionising_luminosity()

File ~/work/synthesizer/synthesizer/src/synthesizer/grid.py:231, in Grid._get_axes(self)
    229 """Get the grid axes from the HDF5 file."""
    230 # Get basic info of the grid
--> 231 with h5py.File(self.grid_filename, "r") as hf:
    232     self.parameters = {k: v for k, v in hf.attrs.items()}
    234     # Get list of axes

File /opt/hostedtoolcache/Python/3.10.14/x64/lib/python3.10/site-packages/h5py/_hl/files.py:562, in File.__init__(self, name, mode, driver, libver, userblock_size, swmr, rdcc_nslots, rdcc_nbytes, rdcc_w0, track_order, fs_strategy, fs_persist, fs_threshold, fs_page_size, page_buf_size, min_meta_keep, min_raw_keep, locking, alignment_threshold, alignment_interval, meta_block_size, **kwds)
    553     fapl = make_fapl(driver, libver, rdcc_nslots, rdcc_nbytes, rdcc_w0,
    554                      locking, page_buf_size, min_meta_keep, min_raw_keep,
    555                      alignment_threshold=alignment_threshold,
    556                      alignment_interval=alignment_interval,
    557                      meta_block_size=meta_block_size,
    558                      **kwds)
    559     fcpl = make_fcpl(track_order=track_order, fs_strategy=fs_strategy,
    560                      fs_persist=fs_persist, fs_threshold=fs_threshold,
    561                      fs_page_size=fs_page_size)
--> 562     fid = make_fid(name, mode, userblock_size, fapl, fcpl, swmr=swmr)
    564 if isinstance(libver, tuple):
    565     self._libver = libver

File /opt/hostedtoolcache/Python/3.10.14/x64/lib/python3.10/site-packages/h5py/_hl/files.py:235, in make_fid(name, mode, userblock_size, fapl, fcpl, swmr)
    233     if swmr and swmr_support:
    234         flags |= h5f.ACC_SWMR_READ
--> 235     fid = h5f.open(name, flags, fapl=fapl)
    236 elif mode == 'r+':
    237     fid = h5f.open(name, h5f.ACC_RDWR, fapl=fapl)

File h5py/_objects.pyx:54, in h5py._objects.with_phil.wrapper()

File h5py/_objects.pyx:55, in h5py._objects.with_phil.wrapper()

File h5py/h5f.pyx:102, in h5py.h5f.open()

FileNotFoundError: [Errno 2] Unable to synchronously open file (unable to open file: name = '../../../tests/test_grid//MW3.1.hdf5', errno = 2, error message = 'No such file or directory', flags = 0, o_flags = 0)
[23]:
tau_v_ISM = 0.5  # ISM component of dust attenuation
tau_v_BC = 0.5  # birth-cloud componest of dust attenuation
tau_v = [tau_v_ISM, tau_v_BC]
alpha = [-0.7, -1.3]
mdust = 5e9 * Msun
dust_emission_model = IR_templates(grid_ir, mdust=mdust, gamma=0.05)

galaxy.stars.get_spectra_pacman(
    grid,
    tau_v=tau_v,
    alpha=alpha,
    young_old_thresh=1e7 * Myr,
    dust_emission_model=dust_emission_model,
)


galaxy.stars.plot_spectra(spectra_to_plot=["old_dust", "young_dust", "dust"])
galaxy.stars.plot_spectra(
    spectra_to_plot=["old_total", "young_total", "total"]
)
plt.xlim(1e4, 5e7)

print(
    "Dust luminosity =",
    galaxy.stars.spectra["total"].measure_window_luminosity(
        window=[1e4 * Angstrom, 1e7 * Angstrom]
    ),
)
---------------------------------------------------------------------------
NameError                                 Traceback (most recent call last)
Cell In[23], line 6
      4 alpha = [-0.7, -1.3]
      5 mdust = 5e9 * Msun
----> 6 dust_emission_model = IR_templates(grid_ir, mdust=mdust, gamma=0.05)
      8 galaxy.stars.get_spectra_pacman(
      9     grid,
     10     tau_v=tau_v,
   (...)
     13     dust_emission_model=dust_emission_model,
     14 )
     17 galaxy.stars.plot_spectra(spectra_to_plot=["old_dust", "young_dust", "dust"])

NameError: name 'grid_ir' is not defined
Galaxy summary
Like other objects in synthesizer we can also get a useful summary of the Galaxy object just using the print function:
[24]:
print(galaxy)
-------------------------------------------------------------------------------
                            SUMMARY OF PARAMETRIC GALAXY
                           ⠀⠀⠀⠀⠀⠀⠀⠀⠀⠀⢀⣀⣀⡀⠒⠒⠦⣄⡀⠀⠀⠀⠀⠀⠀⠀
                           ⠀⠀⠀⠀⠀⢀⣤⣶⡾⠿⠿⠿⠿⣿⣿⣶⣦⣄⠙⠷⣤⡀⠀⠀⠀⠀
                           ⠀⠀⠀⣠⡾⠛⠉⠀⠀⠀⠀⠀⠀⠀⠈⠙⠻⣿⣷⣄⠘⢿⡄⠀⠀⠀
                           ⠀⢀⡾⠋⠀⠀⠀⠀⠀⠀⠀⠀⠐⠂⠠⢄⡀⠈⢿⣿⣧⠈⢿⡄⠀⠀
                           ⢀⠏⠀⠀⠀⢀⠄⣀⣴⣾⠿⠛⠛⠛⠷⣦⡙⢦⠀⢻⣿⡆⠘⡇⠀⠀
                           ⠀⠀⠀+-+-+-+-+-+-+-+-+-+-+-+⡇⠀⠀
                           ⠀⠀⠀|S|Y|N|T|H|E|S|I|Z|E|R|⠃⠀⠀
                           ⠀⠀⢰+-+-+-+-+-+-+-+-+-+-+-+⠀⠀⠀
                           ⠀⠀⢸⡇⠸⣿⣷⠀⢳⡈⢿⣦⣀⣀⣀⣠⣴⣾⠟⠁⠀⠀⠀⠀⢀⡎
                           ⠀⠀⠘⣷⠀⢻⣿⣧⠀⠙⠢⠌⢉⣛⠛⠋⠉⠀⠀⠀⠀⠀⠀⣠⠎⠀
                           ⠀⠀⠀⠹⣧⡀⠻⣿⣷⣄⡀⠀⠀⠀⠀⠀⠀⠀⠀⠀⢀⣠⡾⠃⠀⠀
                           ⠀⠀⠀⠀⠈⠻⣤⡈⠻⢿⣿⣷⣦⣤⣤⣤⣤⣤⣴⡾⠛⠉⠀⠀⠀⠀
                           ⠀⠀⠀⠀⠀⠀⠈⠙⠶⢤⣈⣉⠛⠛⠛⠛⠋⠉⠀⠀⠀⠀⠀⠀⠀⠀
                           ⠀⠀⠀⠀⠀⠀⠀⠀⠀⠀⠀⠀⠉⠉⠉⠁⠀⠀⠀⠀⠀⠀⠀⠀⠀⠀


<class 'synthesizer.parametric.galaxy.Galaxy'>
log10(stellar mass formed/Msol):             8.0
available SEDs:
    Stellar:  [incident, transmitted, nebular, escaped, reprocessed,
               attenuated, emergent, young_incident, young_transmitted,
               young_reprocessed, young_intrinsic, old_incident,
               old_nebular, old_reprocessed, old_intrinsic,
               young_attenuated, old_attenuated, young_emergent, old_emergent,
               total, young_dust_BC, young_dust_ISM, young_dust, old_dust,
               old_total]
    Black Holes:  []
    Combined: []
available lines: []
available images: []
-------------------------------------------------------------------------------
We can also extract an spectra and generate broadband photometry. See the Sed and Filter tutorials:
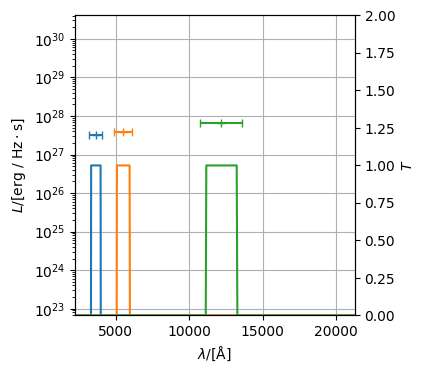
[25]:
sed = galaxy.stars.spectra["emergent"]

tophats = {
    "U": {"lam_eff": 3650, "lam_fwhm": 660},
    "V": {"lam_eff": 5510, "lam_fwhm": 880},
    "J": {"lam_eff": 12200, "lam_fwhm": 2130},
}
fc = FilterCollection(tophat_dict=tophats, new_lam=grid.lam)
bb_lnu = sed.get_photo_luminosities(fc)

print(bb_lnu)

# Plot the photometry
fig, ax = bb_lnu.plot_photometry(show=True)
--------------------------------------------
|         PHOTOMETRY (LUMINOSITY)          |
|--------------------|---------------------|
| U (λ = 3.64e+03 Å) | 3.17e+27 erg/(Hz*s) |
|--------------------|---------------------|
| V (λ = 5.51e+03 Å) | 3.83e+27 erg/(Hz*s) |
|--------------------|---------------------|
| J (λ = 1.22e+04 Å) | 6.68e+27 erg/(Hz*s) |
--------------------------------------------